REPORTS OF BEE LOSSES – U.S.,CANADA & EUROPE
THESE REPORTS ARE SUMMARIESOF LOSSES THIS PAST WINTER WITH SOME BACKGROUND ON PREVIOUS LOSS LEVELS D.M. CARON SEPT 2015 BIP COLONY LOSS 2014–2015: PRELIMINARY RESULTS =23.7%
Nathalie Steinhauer1, Karen Rennich1, Kathleen Lee2, Jeffery Pettis3, David R. Tarpy4, Juliana Rangel5, Dewey Caron6, Ramesh Sagili6, John A. Skinner7, Michael E. Wilson7, James T. Wilkes8, Keith S. Delaplane9, Robyn Rose10, Dennis vanEngelsdorp1 1 Department of Entomology, University of Maryland, College Park, MD 20742 2 Department of Entomology, University of Minnesota, St. Paul, MN 55108 3 United States Department of Agriculture, Agricultural Research Service, Beltsville, MD 4 Department of Entomology, North Carolina State University, Raleigh NC 27695 5 Department of Entomology, Texas A&M University, College Station, TX 77843 6 Department of Horticulture, Oregon State University, Corvallis, OR 97331 7 Department of Entomology and Plant Pathology, University of Tennessee, Knoxville, TN 37996 8 Department of Computer Science, Appalachian State University, Boone, NC 28608 9 Department of Entomology, University of Georgia, Athens, GA 30602 10 United States Department of Agriculture, Animal and Plant Health Inspection Service, Riverdale, MD
The Bee Informed Partnership (http://beeinformed.org),  in collaboration with the Apiary Inspectors of America (AIA) and the United States Department of Agriculture (USDA), is releasing preliminary results for the ninth annual national survey of honey bee colony losses. For the 2014/2015 winter season, a preliminary 6,128 beekeepers in the United States provided valid responses. Collectively, these beekeepers managed 398,247 colonies in October 2014, representing about 14.5% of the country’s estimated 2.74 million managed honey bee colonies1.
About two-thirds of the respondents (67.2%) experienced winter colony loss rates greater than the average self-reported acceptable winter mortality rate of 18.7%. Preliminary results estimate that a total of 23.1% of the colonies managed in the Unites States were lost over the 2014/2015 winter. This would represent a decrease in losses of 0.6% compared to the previous 2013/2014 winter, which had reported a total loss estimated at 23.7%. This is the second year in a row the reported colony loss rate was notably lower than the 9-year average total loss of 28.7% (see Figure 1 next page).
Beekeepers do not only lose colonies in the winter but also throughout the summer, sometimes at significant levels. To quantify this claim of non-winter colony mortality of surveyed beekeepers, we have included summer and annual colony losses since 2010/2011. In the summer of 2014 (April – October), colony losses surpassed winter losses at 27.4% (total summer loss). This compares to summer losses of 19.8% in 2013. Importantly, commercial beekeepers appear to consistently lose greater numbers of colonies over the summer months than over the winter months, whereas the opposite seems true for smaller-scale beekeepers. Responding beekeepers reported losing 42.1% of the total number of colonies managed over the last year (total annual loss, between April 2014 and April 2015). This represents the second highest annual loss recorded to date.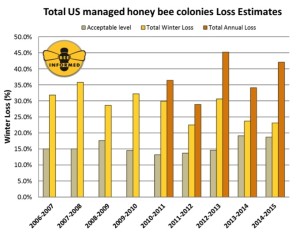
Figure 1: Summary of the total colony losses overwinter (October 1 – April 1) and over the year (April 1 – April 1) of managed honey bee colonies in the United States. The acceptable range is the average percentage of acceptable colony losses declared by the survey participants in each of the nine years of the survey. Winter and Annual losses are calculated based on different respondent pools.
As in previous years, colony losses were not consistent across the country, with annual losses exceeding 60% in several states, while Hawaii reported the lowest total annual colony loss of ~14% (see Figure 2). 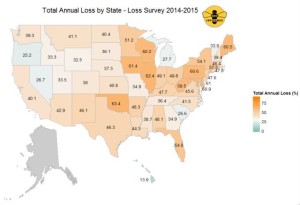
Figure 2: Total annual loss (%) 2014-2015 by state. Respondents who managed colonies in more than one state had all of their colonies counted in each state in which they reported managing colonies. Data for states with fewer than five respondents are withheld.
This survey was conducted by the Bee Informed Partnership, which receives a majority of its funding from the National Institute of Food and Agriculture, USDA (award number: 2011-67007-20017).
1 Based on NASS 2015 figures 2 Previous survey results found a total colony loss in the winters of 24% in the winter of 2013/2014, 30% in 2012/2013, 22% in 2011/2012, 30% in 2010/2011, 32% in 2009/2010, 29% in 2008/2009, 36% in 2007/2008, and 32% in 2006/2007 (see reference list). Lee, KV; Steinhauer, N; Rennich, K; Wilson, ME; Tarpy, DR; Caron, DM; Rose, R; Delaplane, KS; Baylis, K; Lengerich, EJ; Pettis, J; Skinner, JA; Wilkes, JT; Sagili, R; vanEngelsdorp, D; for the Bee Informed Partnership (2015) A national survey of managed honey bee 2013–2014 annual colony losses in the USA. Apidologie, 1–14. DOI:10.1007/s13592-015-0356-z Steinhauer, NA; Rennich, K; Wilson, ME; Caron, DM; Lengerich, EJ; Pettis, JS; Rose, R; Skinner, JA; Tarpy, DR; Wilkes, JT; vanEngelsdorp, D (2014) A national survey of managed honey bee 2012-2013 annual colony losses in the USA: results from the Bee Informed Partnership. Journal of Apicultural Research, 53(1): 1–18. DOI:10.3896/IBRA.1.53.1.01 Spleen, AM; Lengerich, EJ; Rennich, K; Caron, D; Rose, R; Pettis, JS; Henson, M; Wilkes, JT; Wilson, M; Stitzinger, J; Lee, K; Andree, M; Snyder, R; vanEngelsdorp, D (2013) A national survey of managed honey bee 2011-12 winter colony losses in the United States: results from the Bee Informed Partnership. Journal of Apicultural Research, 52(2): 44–53. DOI:10.3896/IBRA.1.52.2.07 vanEngelsdorp, D; Caron, D; Hayes, J; Underwood, R; Henson, M; Rennich, K; Spleen, A; Andree, M; Snyder, R; Lee, K; Roccasecca, K; Wilson, M; Wilkes, J; Lengerich, E; Pettis, J (2012) A national survey of managed honey bee 2010-11 winter colony losses in the USA: results from the Bee Informed Partnership. Journal of Apicultural Research, 51(1): 115–124. DOI:10.3896/IBRA.1.51.1.14 vanEngelsdorp, D; Hayes, J; Underwood, RM; Caron, D; Pettis, J (2011) A survey of managed honey bee colony losses in the USA, fall 2009 to winter 2010. Journal of Apicultural Research, 50(1): 1–10. DOI:10.3896/IBRA.1.50.1.01 vanEngelsdorp, D; Hayes, J; Underwood, RM; Pettis, JS (2010) A survey of honey bee colony losses in the United States, fall 2008 to spring 2009. Journal of Apicultural Research, 49(1): 7–14. DOI:10.3896/IBRA.1.49.1.03 vanEngelsdorp, D; Hayes, J; Underwood, RM; Pettis, J (2008) A Survey of Honey Bee Colony Losses in the U.S., Fall 2007 to Spring 2008. PLoS ONE, 3(12). DOI:10.1371/journal.pone.000407 vanEngelsdorp, D; Underwood, R; Caron, D; Hayes, J (2007) An estimate of managed colony losses in the winter of 2006-2007: American Bee Journal 147(7):599-603
Note: This is a preliminary analysis. Sample sizes and estimates are likely to change. A more detailed final report is being prepared for publication in a peer-reviewed journal at a later date.
Canadian Association of Professional Apiculturists Statement on Honey Bee Wintering Losses in Canada (2015) = 16.4%
The Canadian Association of Professional Apiculturists (CAPA) conducts an annual honey bee wintering loss survey using a set of harmonized questions based on national beekeeping industry profiles.Provincial Apiculturists collected survey data from beekeepers across Canada who own 362,949 honey colonies. This represents 50.8% of all colonies operated and wintered in Canada in 2014. The national average percentage of colony winter loss was 16.4%. Provincial averages ranged from 10.4-37.8%; the highest loss inOntario was a decrease of 34.8% compared to the 58.0% loss reported in 2013/14. Overall, the reported national colony loss is one of the lowest losses since 2006/07 and represents a decrease of 34.4% from 2013/14 winter losses.
Respondents reported considerable variation in identifying and ranking the top 4 possible causes of colony losses. Answers included starvation, weak colonies, poor queens, Nosema and weather conditions. Beekeepers also responded to questions on management of Varroa mites, Nosema and American foulbrood. Over 73% of beekeepers monitored Varroa infestation, the majority using controls used Apivar™, formic acid and oxalic acid for treatments. Despite monitoring Nosema infections less frequently, many beekeepers regularly used fumagillin to treat nosemosis.
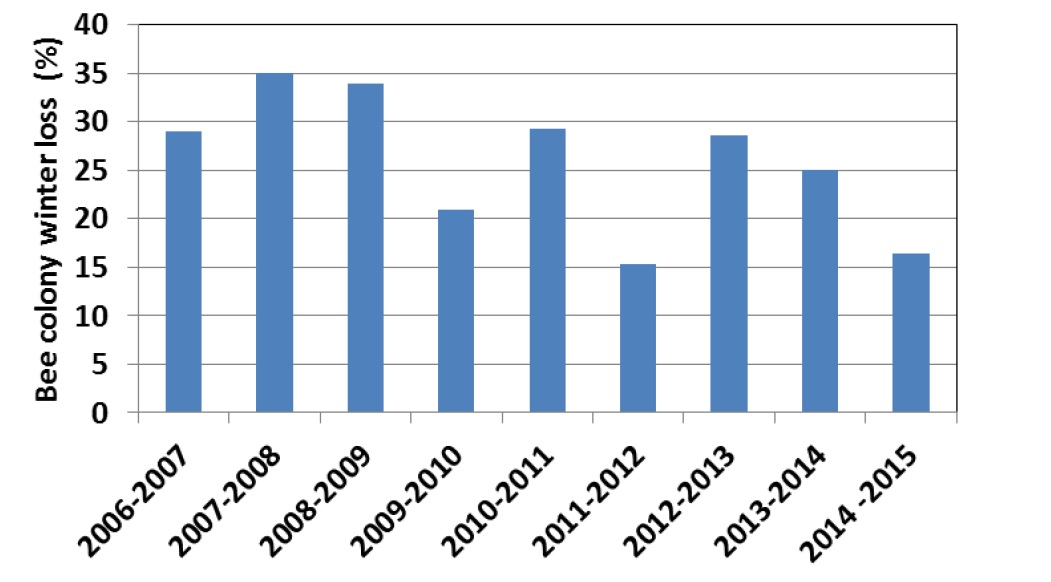
Honey Bee Winter Loss in Canada since 2007
In Canada, winter loss shows a declining trend since 2010 (Fig 1). The winter losses were highest in 2007 to 2009 ranging from 29.0 – 35% (average 32.6%). From 2010 to 2015, losses ranged from 16.4 to 29.3% (average 23.8%).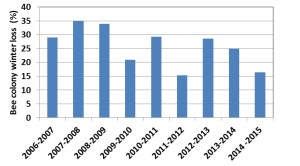
It should be noted that the reported winter loss in 2014/2015 was in most of the provinces within the acceptable long term targeted winter loss by beekeepers. These reports of multi-year surveys provide evidence that Canadian beekeepers have been successfully addressing bee health issues, although beekeepers have access to few effective chemical products to control Varroa mite and Nosema. If resistance develops today to any of these products and alternative treatments are not
available or are still under development, beekeepers will suffer serious consequences. Ultimately, beekeepers must consider an integrated approach to maintain healthy bees. This approach is not only limited to pest management, but it includes proper nutrition, large healthy bee populations throughout the year, and reducing exposure to pesticides.
Losses of honey bee colonies over the 2014/15 winter – Preliminary results from Europe =17.4%
The honey bee research association COLOSS provided preliminary results of their international study of colony losses over the 2014-15 winter. Data were collected from 31 countries. Egypt, Russia and the Ukraine participated for the first time in this initiative, which is the largest and longest running international study of honey bee colony losses. In total 23,234 respondents provided overwintering mortality and other data of their colonies.
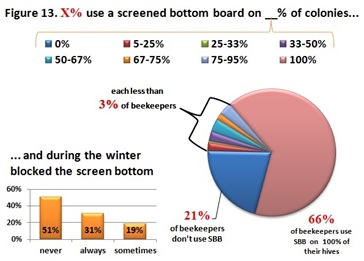
Collectively, all responding beekeepers managed 469,249 honey bee colonies. 67,914 of these colonies were dead after winter and an estimated 3 % of these colonies were lost because of unsolvable queen problems after winter. A preliminary analysis of the data shows that the mortality rate over the 2014-15 winter varied between countries, ranging from 5 % in Norway to 25 % in Austria, and there were also marked regional differences within most countries. The overall proportion of colonies lost (including colonies with unsolvable queen problems after winter) was estimated as 17.4 %, which was twice that of the previous winter.
The protocol used to collect this COLOSS data has been internationally standardized to allow comparisons and joint analysis of the data. A more detailed analysis of risk factors calculated from the whole dataset , as well as further colony loss data from other countries, will be published later in the year.
International Data Coordinator for the COLOSS Monitoring and Diagnosis Working Group Romée van der Zee from the Dutch Centre for Bee Research says: “North European countries have traditionally had lower losses,compared to west and central European countries. This can partly be explained by the later start of the breeding season of their honey bee colonies due to low temperatures in March/April, as was the case in 2014. This later start limits the number of brood cycles of the varroa mite, one of the main parasites of honey bees. However, honey bee colony loss is a multifactorial problem. There is clearly also a variation in losses between areas, which is not dependent on the varroa mite. One of the main aims of our network is to identify and describe such areas.”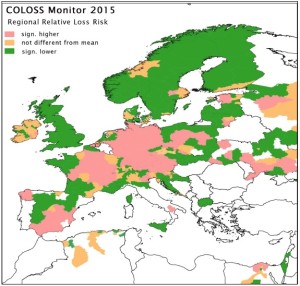
Sources: BIP https://beeinformed.org/2015/05/colony-loss-2014-2015-preliminary-results/
CAPA: http://capabees.org/shared/2015/07/2015-CAPA-Statement-on-Colony-Losses-July-16-Final-16-30.pdf
Coloss: http://www.coloss.org/announcements/losses-of-honey-bee-colonies-over-the-2014-15-winter-preliminary-results-from-an-international-study
To download a copy of this report click here
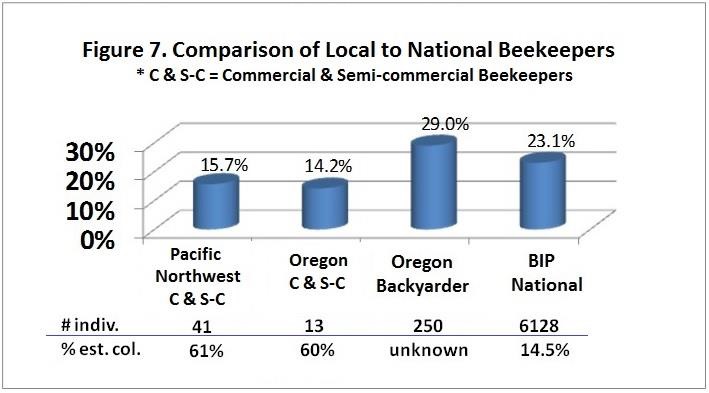

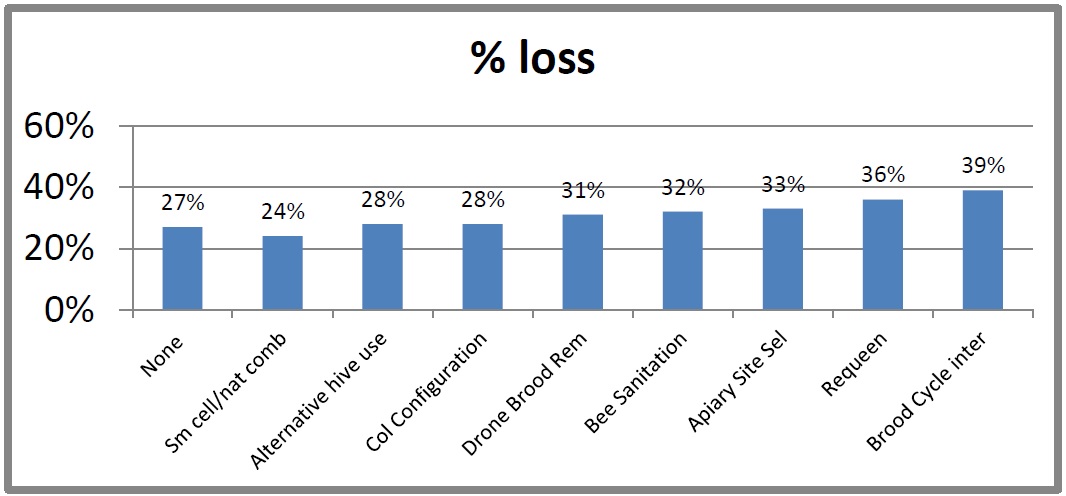


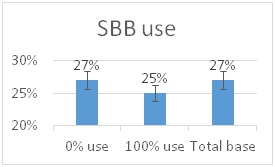 he overall 250 respondent base) compared to the79% who did (25% middle column in left graphic – column on right of graphic is overall loss rate for those beekeepers using either 8-frame or 10 frame Langstroth hives – when the data for individuals who used other hive types besides Langstroth is included, the overall overwinter loss rate for backyarders was 29%).
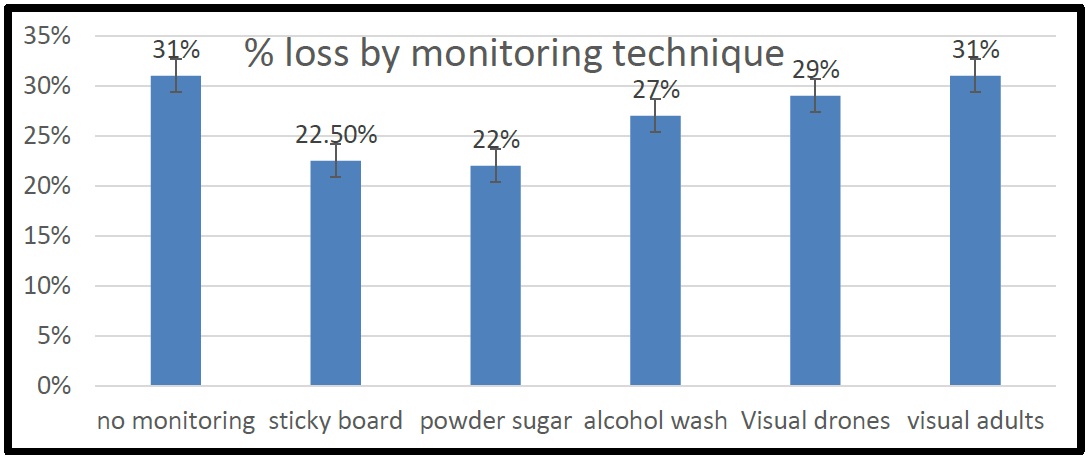
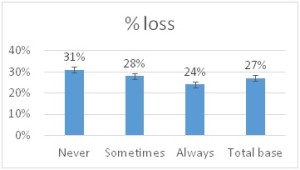 (never response). 19% sometimes blocked them and 31% said they closed them (always response) during the winter (see graphic right). When we examined winter losses for this response, there was no statistical dfference in loss, although the trend was for lower losses when the SBB were closed (24% vs 31%).