** Looking for a report in your specific region? Refer to the Individual Club Reports page.
** scroll down to see the Washington Backyard Beekeepers Winter Bee Loss Report, 2017-2018 [click here to view Washington as PDF]
Oregon Backyard Beekeepers Winter Bee Loss Report, 2017-2018
by Dewey M. Caron and Jenai Fitzpatrick
[click here to view Oregon as PDF]
Overwintering losses of small scale Oregon backyard beekeepers were reduced this past winter compared with the previous (2016-17) season. The reason(s) for colony losses are not always obvious as there often are several contributing factors. Herein we review and discuss the data provided by303 Oregon smaller-scale beekeepers, 20 more respondents than last year.
This report presents the results of a 10th season of loss surveys of small-scale Oregon (hobbyist) backyard beekeepers and the 5th season of the expanded digital version. This annual survey is conducted electronically at www.pnwhoneybeesurvey.com during April and supplemented with paper surveys distributed at several local association meetings in March and April. In all, 407 valid surveys were returned, 303 from Oregon and 104 from Washington beekeepers. Please see scroll down for the report for Washington beekeepers.
Characterization of survey respondents
Surveys were received from members of 14 local Oregon (OR) associations and several Washington (WA) associations. The majority of the OR respondents (225= 74%) keep bees in Oregon’s Willamette Valley. Additional surveys were received from 20 Coastal beekeepers (10 from Tillamook beekeepers), 13 from Hood River, 16 from Central OR and 20 from Southern Oregon beekeepers. The majority (80=77%) of Washington responses were from beekeepers in the I-5 corridor Vancouver to Tacoma area. In bar graph below, the number beside club name shows club respondent numbers and percent figure at end of bar represents the loss level percent of each association.
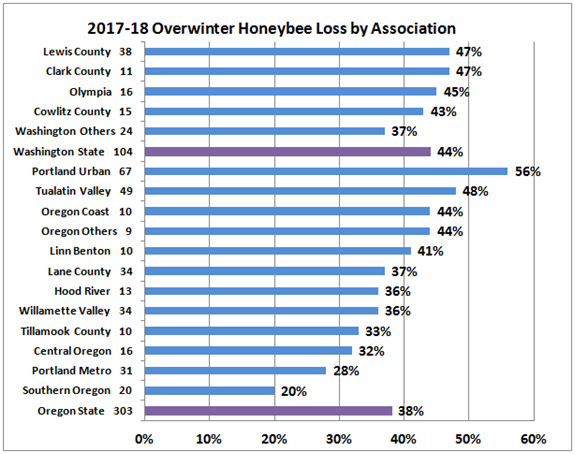
Figure 1
We asked if there was a mentor available for the first years of beekeeping. 69% Oregon beekeepers indicated YES as did 73% of Washington beekeepers. This is encouraging as the learning curve is a steep one for new beekeepers and mentors can significantly help new individuals get through the critical first years of bee husbandry.
2017-2018 Overwinter losses (based on hive type)
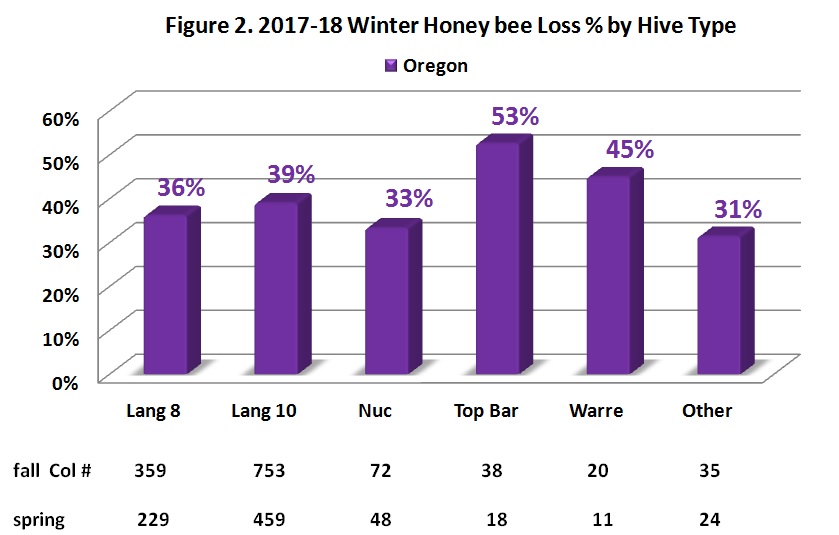
The loss statistic was developed by asking number of fall colonies and surviving number in the spring by hive type. Total Oregon backyard beekeeper overwinter loss = 38%. Results are shown in bar graph of Figure 2. Respondents had 1277 fall colonies with 789 colonies surviving in the spring. Eighty nine percent of hives were 8 and 10-frame Langstroth hives. Fifty four individuals (19% of respondents) maintained more than one hive type. 5% of hives were alternative hives with no-movable frames.
To better characterize the survey population, we asked how many years of beekeeping experience survey respondents had. The median years of beekeeping experience for Oregon beekeepers was 4 years. Forty two percent of respondents indicated 1, 2 or 3 years of experience, 95 individuals (32%) had 4 or 5 years’ experience and 40 individuals (13%) had ten years or more of experience. Eight individuals listed 30 or more years of experience with 50 years the largest.
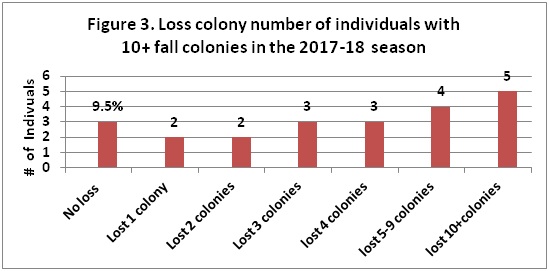
There were 25 beekeepers (9.5%) who had more than 25 fall colonies. Three of these individuals (12%) lost no colonies, 2 lost one or two colonies, 3 lost 3 or 4 colonies, 4 lost 5-9 colonies and 5 lost 10 or more colonies. These individuals tended to have more beekeeping experience. Nine had 3 to 5 years’ experience, 8 had 6-8 years, 3 had 10 to 17 years and 7 had 20 to 50 years’ experience.
The 36% winter losses of PNW 8-frame Langstroth hives was 3 percentage points lower than the 39% loss rate of 10-frame Langstroth hives which is not statistically different. In fact there has been no statistical difference in 3 of 4 years in loss percent between 8 and 10 frame hives; nuc losses are often higher but were a bit lower this past winter and both Top bar and Warré hive losses were higher. Of the 35 “other” hive types, 6 of the long hives survived, neither of the 2 flow hives survived, 3 of the 5 tree hives survived, only 1 of the 4 insulated hives survived. The remainder of “other hives types” were not specifically noted by respondents.
The 104 Washington beekeepers, entering the fall with 457 colonies had a slightly higher loss rate of 44%. The reason(s) for higher losses by Washington beekeepers the past three years are unknown but the lower number of Washington respondents compared to Oregon could be partly responsible. Small numbers, such as with individual clubs, are more difficult to interpret; one or two returns can skew results.
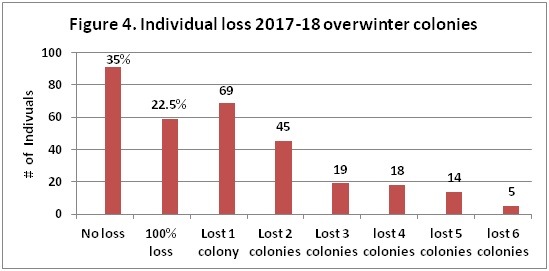
Thirty-five percent (34%) of Oregon respondents (91 individuals) had NO LOSS overwinter, whereas 22.5% (59 individuals) lost 100% of fall colonies. Sixty nine individuals lost 1 colony, 45 individuals lost two colonies, 19 respondents lost 3 colonies and 18 lost 4 colonies. Fourteen individuals lost 6 to 9 colonies and 5 individuals (all who had 10+ fall colonies) lost 10 or more colonies – highest loss was 18 colonies. Numbers are reflective of the fact that backyarders keep on average 3 colonies.
Loss rates at different locations
We asked loss related to location of the hive. Eighty-eight percent of respondents kept bees at a single location. 34 individuals had two locations, 11 had 3 sites and 3 had 4 apiary locations. Loss numbers were higher at 2nd/3rd apiary sites (33% loss compared to 28% at the primary location) Information supplied on location will be used to develop location density maps, similar to the 2014 pilot study maps by Jenai.
Overwinter losses of members of different organizations are shown in the Figure 1 above. The loss rates varied from a low of 20% for the Southern Oregon beekeeper respondents to a high of 55% in PUB Association. The range of losses, nearly 3 time difference, was the greater than last year (a 2-fold difference of (34 to 70% loss rates) but less than the previous year range of 20%to 80%, a 4-fold difference. Bar length of Figure 1 is expression of percent loss.
Twenty five individuals (9%) moved colonies during the year. Reasons listed for move included 7 individuals who moved anywhere from a few yards to several feet to improve hive siting, 4 individuals who moved for better forage conditions, 5 moved a hive as gift from or to give to friend/family and 2 moved bees for pollination. One had to move from bear predation, another to escape high hive numbers of commercial neighbor and another because there were too many colonies for the city regulations. One indicated moving hives to avoid pesticide damage, another lost the apiary site and one moved as they lost interest.
Comparison to larger-scale beekeeper losses
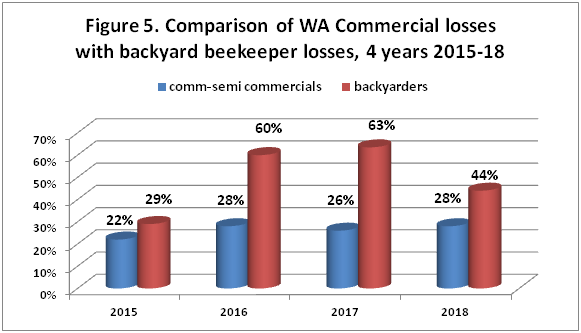
A different (paper) survey instrument was mailed to Pacific Northwest (PNW) semi-commercial (50-500 colonies) and commercial beekeepers (500+) asking about their overwintering losses. Seven Oregon commercial and six semi-commercial beekeepers (36,801 colonies, approximately 50% of the estimated total number of colonies in the state) reported overwinter losses of 15%. Small scale beekeeper losses were one percentage point less than the average of the 3 previous years while commercial/semi-commercial losses were 3 percentage points less than the average of the previous three years. The good news was that both large and small-scale beekeepers loss rates were 10 percentage points lower than the previous winter. Comparisons of losses for the last 4 years are shown in Figure 5.
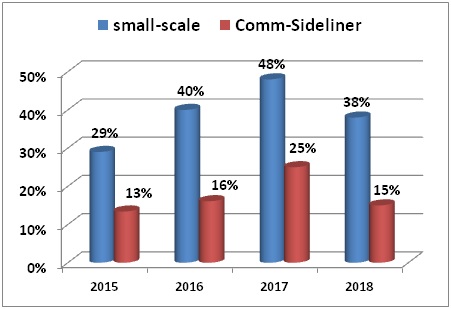
Backyard losses, slightly more than double the losses of larger-scale beekeepers, have consistently been higher over 7 years of survey responses. Commercial and semi-commercial beekeepers take losses in the fall and are more pro-active in varroa mite control management are two possible reasons for this difference.
Survival based on hive origination
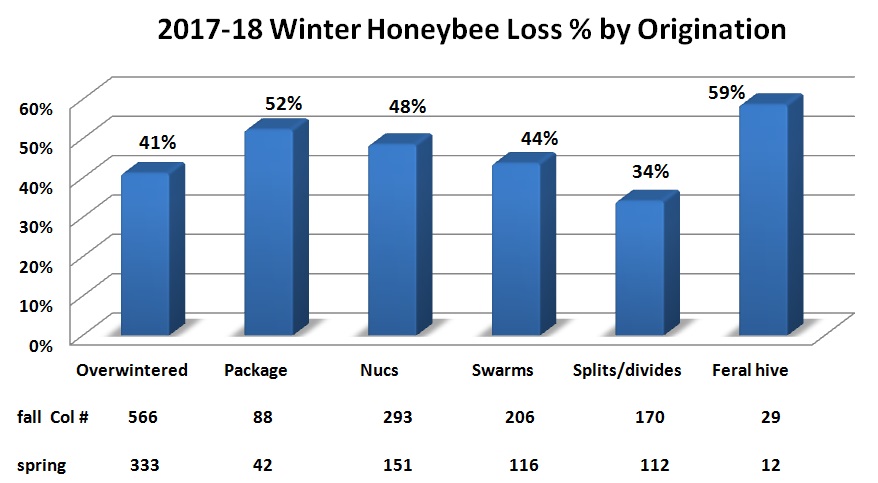
We also asked survey respondents to characterize their loss by hive origination. The result is graphically presented below in Figure 6. There was relatively little difference but as expected overwintered colonies had the best survival (41% loss) and feral hives (59% loss) and packages (52% loss) did the poorest. Splits (34%) and swarm survival (44% loss) did slightly better.
Colony Death perceived reason and acceptable level
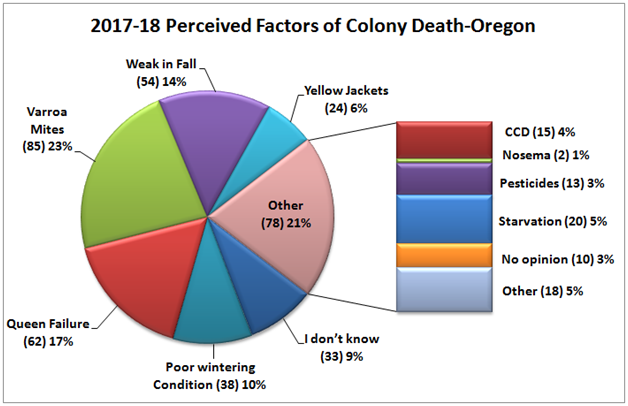
We asked PNW individuals that had colony loss for their expression of what might have been the reason for their loss. More than one option was allowed for those with multiple losses. Most common responses were Varroa mites (23%) and Queen failure (17%), followed closely by Weak in the Fall (14%).Poor wintering conditions (10%) and Yellow jackets (6%) were other common selections. CCD (Colony Collapse Disorder) 4%, a general loss symptom whereby the adults die away from their hive, Pesticides (3%) and starvation (5%) were other selections. No opinion was expressed by 3%.
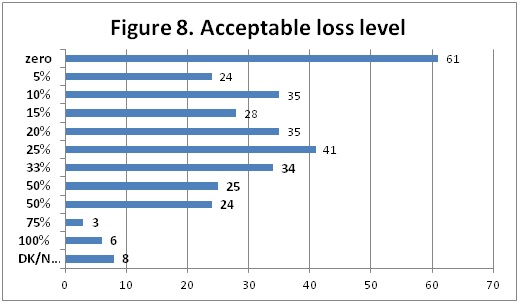
Acceptable loss: Respondents were asked to select an acceptable loss level, being offered several categories to check. Sixty-five individuals (21%) said zero, the most common selection; the median (middle selection) was 15%. Nationally, the Bee Informed survey response to the same question has been between 15 and 19%: this past year it was 15%. Oregon data shown in Figure 8 below.
There is no easy way to verify reason(s) for colony loss. Colonies in the same apiary may die for different reasons. Doing the dead colony examination (necropsy) is the first step in seeking to solve the heavy loss problem. See report on Dead Colony examination (2 dead colony necropsies at Zenger Apiary of PUB club) posted to the website. More attention to colony strength and possibility of mitigating winter starvation will help reduce some of the losses. Effectively controlling varroa mites will definitely help reduce losses.
Why do colonies die? There appears to be no single reason for loss and a good deal of variance in opinion as to what might be an acceptable loss level. There is nobody to come verify why a dead colony died. Close examination may eliminate some possible factors but we are still often left with more than one “likely” cause of death. Nationally the BIP data base indicates that about 1/3 of individuals have no loss or very low losses, about a 1/3 have losses around the average figures for the year while the 1/3rd with heaviest losses tend to be individuals who are not doing, or perhaps not properly doing, varroa mite control.
We are dealing with living animals which are constantly exposed to many different challenges, both in the natural environment and the beekeeper’s apiary. The four major factors in colony loss are thought to be mites, pesticides, declining nutrition adequacy of the environment and diseases, especially viruses and Nosema. Management, failure to do something or doing things incorrectly, remains a factor in our losses as does alteration to the bee’s natural environment.
Langstroth wrote about the importance of taking losses in fall management saying if the beekeeper neglects such attention to his/her colonies, 45% loss levels may occur, depending upon variable environmental conditions. It can be argued that losses of 30% or more might be “normal.” Older, more experienced beekeepers recall when loss levels were 15% or less. Honey production fluctuates each year but, once again, seems to be declining on average. Numbers of U.S. bee colonies have declined steadily since the 1940s, returning to numbers of 100 years ago; worldwide numbers of bee colonies are steadily increasing.
There is no simple answer to explain the levels of current losses nor is it possible to demonstrate that they are excessive for all the issues facing honey bees in the current environment. Better Bee Health remains elusive.
General hive practices and losses
We asked in the survey for information about some managements practiced by respondents. Multiple responses were possible. The survey inquired about feeding practices, wintering preparations, sanitation measures utilized, screen bottom board usage, queens, mite monitoring and both mite control techniques (such as screen bottom board use, drone brood removal efforts, etc.) and chemical mite controls used.
This analysis seeks to compare responses of this past season to previous survey years. With management choices Individuals could check none or more than one response and there was another category to add personalized managements. Most OR beekeepers do not do just one management to their colony (ies) toward improving overwintering success. This analysis however is mainly of a single factor equated with loss level.
FEEDING: Oregon survey respondents checked 740 feeding options = 2.6/individual. 42 individuals (50%) selected a single choice, 71 individuals had 2 choices, 93 (the medium number) had 3 choices and 45 individuals used 4 choices. 10% of respondents indicated 5+ choices (21 individuals had 5 choices, 6 individuals chose 6 and one had 7 choices).
Twenty five individuals said they did NO FEEDING. They had 71 fall colonies and realized a 46.5% loss. Seven (28%) of these same individuals also indicated not doing any winterization, 4 of these 7 also did no sanitization (and other 3 used selections of Minimal hive management or alternative hive, 6 did no non-chemical treatment and only one of these 7 individuals used a chemical (ApiLifeVar).
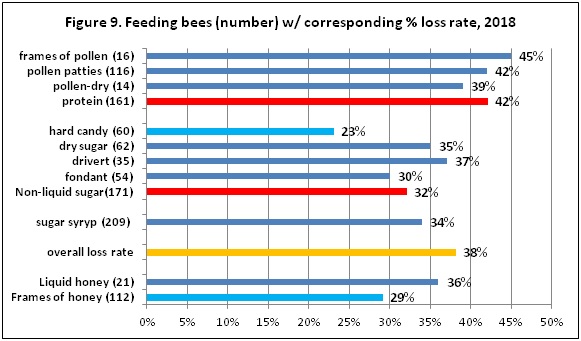
For individuals indicating one or more feeding managements, feeding sugar syrup was the most common feeding option of respondents. The choices with number of individuals in ( ) and bar length indicating loss level individuals ding this management are shown in Figure 9 (remember that many individuals did more than just this single management). 209 individuals said they used sugar syrup. They had a 34% loss rate, slightly lower than the overall average of Oregon backyard beekeeper losses of 38%. Slightly more than ½ this number (112 individuals) said they fed frames of honey – their lost level (29%) was 9 percentage points better than the overall loss rate. The 21 individuals who fed liquid honey had 36% loss level, similar to overall losses.
Individuals that fed non-liquid sugar collectively had a lower loss level of 32%. Most useful would appear to be hard candy (60 individuals said they supplied their bees with hard candy and had 23% winter losses) and feeding of fondant sugar (54 individuals feeding fondant had a 30% loss level). Feeding of protein did not seem to help lower winter survival this past season (but there might be other good reasons for supplementing protein in bee colonies). All options exhibited losses higher than overall losses.
Comparison of feeding choices between the previous season (when overall losses were higher at 48%) and this last winter shows several similarities. The previous season frames of honey feeders had lower than overall average (40% loss) and feeders of dry sugar (especially hard candy and fondant both showed lower loss level). In the 2016-17, individual feeding pollen patties and dry pollen had lower losses than the overall losses (43% losses for those feeding patties and 27% loss level for those feeding dry pollen – only 17 individual). Numbers of individuals doing the various feeding managements were remarkably similar in both survey years; pollen patty feeding was more popular last year (152 individuals vs 116 this year) and fewer fed fondant this survey season (54 vs 70 last season). See previous season’s data on PNW website.
WINTERING PRACTICES: We received 588 responses about OR beekeeper wintering management practices (more than one option could be chosen), 50 more than last year. Thirty seven individuals (15%) percent of the respondents indicated none of the several listed wintering practices was done; these individuals had a 43.5% winter loss compared to overall of 38%. For those indicating some managements, 64 did one single thing, 126 did 2, 26 did three and 23 did 4. Twelve individuals (5%) did 5 or more (11 did 5, and 1 each listed 6 and 7).
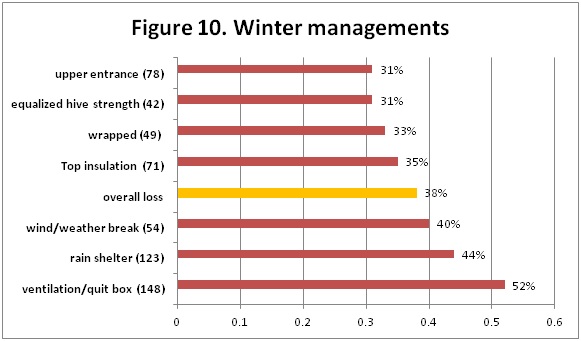
The most common wintering management selected (148 individuals, 15 more than last year) was ventilation/use of a quilt box at colony top followed by rain shelter (123 individuals, 22 more than last night). Figure 10 shows number of individual choices and percent of each selection. Upper entrance and equalizing hive strength were the 2 selections that had lowest losses and wrapped (33% loss) was also showing higher survivorship.
Combining an upper entrance, insulation at top and a ventilation board (alone or in combinations with other managements) did mean a slightly lower 44.5% winter loss rate last year. The variety of indicated choices of these wintering selections demonstrates that backyard beekeepers are taking extra measures to help colonies survive winter conditions.
SANITATION PRACTICES: It is critical that we practice some basic sanitation (some prefer use of term bee biosecurity) in our bee care. We can do more basic sanitary practices to help insure healthy bees. We received 525 responses for this survey question, 13 more than last year. Fifty two individuals (one more than last year) (22%) said they did not practice any of the 6 offered alternatives; they had a loss rate of 34% compared to overall rate of 38%. Ninety four had 1 selection, 70 had 2 choices, 33 selected 3 managements, 22 had 4 choices and only 6 9dividuals (2.5%) had 5 selections. There were 2.2 selections per individual.
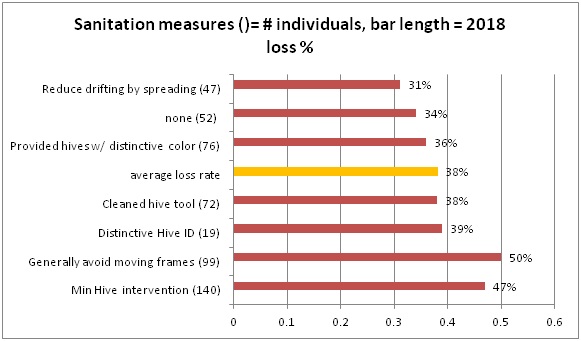
Minimal hive intervention (138 individuals was the most common option selected. It could be argued that less intervention might mean reduced opportunity to compromise bee sanitation efforts of the bees themselves and that excessive inspections/ manipulations can potentially interfere with what the bees are doing to stay healthy. This option however did not improve winter survival, the loss rate for this group was 47%. Last year it also did not show better survival. The management of generally avoiding moving frames also did not seem to reduce losses and in fact showed the highest loss rate at 50%.
The two sanitation choices that did seem to improve survival was reduce drifting by spreading colonies out and providing hives with distinctive ID /doing other hive ID measures. Last year providing hives with distinctive colors showed slightly lower loss rate.
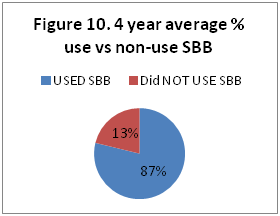
SCREEN BOTTOM BOARDS: Although many beekeepers use SBB to control 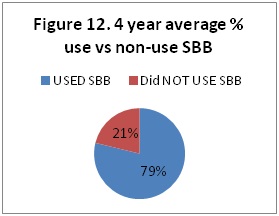 varroa, BIP and PNW surveys clearly point out they are not a very effective varroa mite control tool. In this recent survey 63 individuals (20%) said they did not use screen bottom boards. In 4 PNW survey years 21% said they did not use SBB and 79% did use SBB on some or all of their colonies.
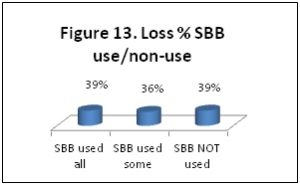 This past overwintering season the 63 non-SBB users had1153 fall colonies of which they lost 452 for 39% loss. Two hundred fourteen (214) beekeepers (67.5%) reporting 765 fall colonies, had loss of 299, so they too had a 39% loss rate. There were 40 beekeepers who reported use of SBB on some of their 199 fall colonies. They lost 71 colonies for a 36% loss rate. The loss rate for the 80% who used SBB on some or all of their colonies, was 38%, one percentage point better than the non-users (39%). Figure 13.
This one percentage point difference is a repeat of the 4 year results of the PNW survey. Differences have been 1, 2 and 13.4 percentage points greater (3 of 4 years) and for the fourth year 8 percentage points less. The four year average of SBB use 41.3% loss level of those using SBB on all or some of their colonies and 43.4% for those not using SBB (a 5% positive gain) illustrates how they are very minor in improving overwinter survival.
We asked if the SBB was left open (always response) or blocked during winter. 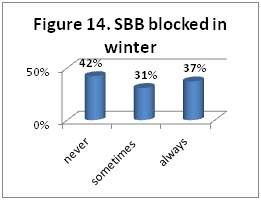 This past season 23% of individuals said they always blocked SBB during winter. They had 412 colonies in the fall and lost 154 for a 37% loss rate. One hundred fourteen individuals (44%) blocked them during winter (never response). They had 408 colonies in the fall and lost 172=42% loss rate, 4 percentage points lower than the average of three previous years. Forty four individuals (17% blocked them on some of their colonies. Their loss rate was 30.7% which was 10.2 percentage points higher than the three year average. Comparing the always and sometimes left open with the closed in winter response reveals a 10 percentage point difference in favor of closing the SBB over the winter period. See Figure 14.
There is no good science on whether open or closed bottoms make a difference in overwinter but some beekeepers “feel” bees do better with it closed overwinter. Four years of comparison shows those closing the screen during winter did have a 10 percentage point improvement in colony survival. An open bottom, at least during the active brood rearing season, can assist the bees in keeping their hive cleaner.
Things that seem to improve winter success: It should be emphasized that these comparisons are correlations not causation. They are single comparisons of one item with loss numbers. Individual beekeepers do not do only one management option nor do they necessarily do the same thing to all the colonies in their care. We do know moisture kills bees, not cold, so we recommend hives be located in the sun out of the wind. If exposed, providing some extra wind/weather protection might improve survival.
Feeding, a common management, showed to be of some help in reducing losses. Feeding fondant sugar or a hard sugar candy during the winter meant lower loss levels. Providing frames of honey also meant lower loses for some individuals. Feeding of sugar syrup, the most common feeding management, did not result in lower losses overwinter but such feeding might be of great value for the spring development and/or development of new/weaker colonies. Feeding protein did not seem to improve survival except in the previous year for a small number of individuals who fed dry pollen. The supplemental feeding of protein (pollen patties), might be of importance earlier in the season.
Two winterizing measures that apparently helped lower losses for some beekeepers was equalizing strength, providing an upper entrance and some wrapping against winter. The most common winterizing managements of providing a rain shelter and use of a ventilation or quilt box (Vivaldi board) at the colony top had the highest loss levels and these measures did not apparently improve overwintering success.
Spreading colonies out in the apiary and painting distinctive colors or doing other measures to reduce drifting appeared to be of some value in reducing winter losses. The two most commonly indicated managements of avoiding movement of frames from one colony to another along with minimal hive intervention did not apparently improved survival.
Replacing standard bottom boards for screened bottoms only marginally improved winter survival. It was advantageous to close the bottom screens during winter.
Mite monitoring/sampling and control management
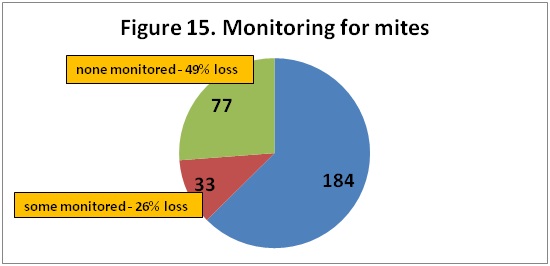
We asked percentage of Oregon hives monitored for mites during the 2016 year and/or overwinter, whether sampling was pre- or post-treatment or both and, of the 5 possible mite sampling methods, what method was used and when it was employed. 184 individual respondents (63%), 6 more than last year, said they monitored all their hives and when those individuals monitoring was compared to loss, this group had a 38% loss an improvement of 5 percentage points over the previous year (43%) loss. Seventy seven (22%), 15 more than last year, reported no monitoring and they had the higher loss rate, 49% loss. 33 individuals reported monitoring some of their colonies; they had a 26% loss.
The previous year those individuals monitoring all colonies (178 individuals) had a 43% loss while those 62 individuals not monitoring had a 48% loss. With 2 survey years there was an advantage with monitoring average of 8 percentage point lower losses (48.5% no monitoring vs 40.5% loss total monitoring) a 20% advantage to monitoring
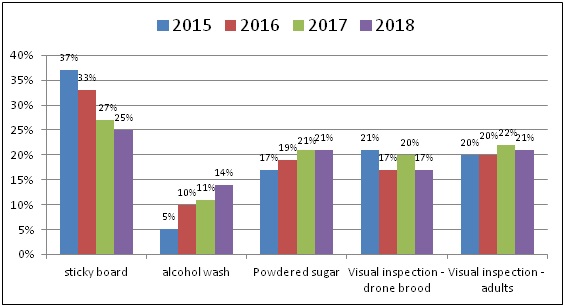
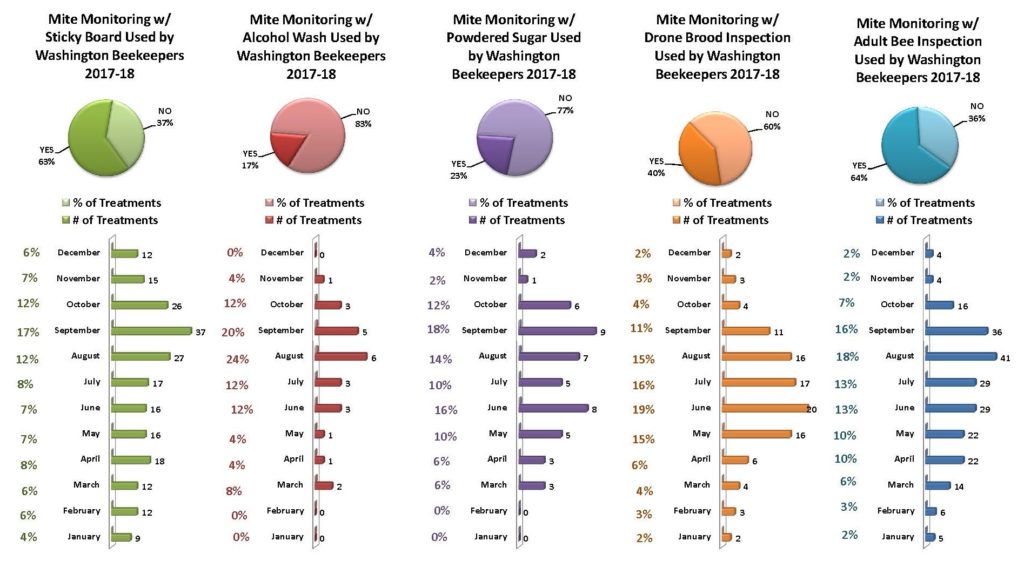
In order of popularity of use, Sticky boards were used by 110 individuals (25%), continuing to decrease in popularity, followed by 95 individuals using powdered sugar monitoring (21%), and visual inspection of adults, both 21%. Visual inspection of drone brood was done by 72 individuals=17% and alcohol wash was reported by 61 individuals 14%. Figure 16.
Some 68% of individuals used more than one method. 32% of individuals used a single monitoring method (23 individuals alcohol wash, 19 sticky board and 18 powder sugar), 39% used 2 methods, 24% used 3, 5% (10 individuals) used 4 and 1 individual used all 5. Powdered sugar shake and alcohol wash are both increasingly used; they are the preferred monitoring methods that best estimate
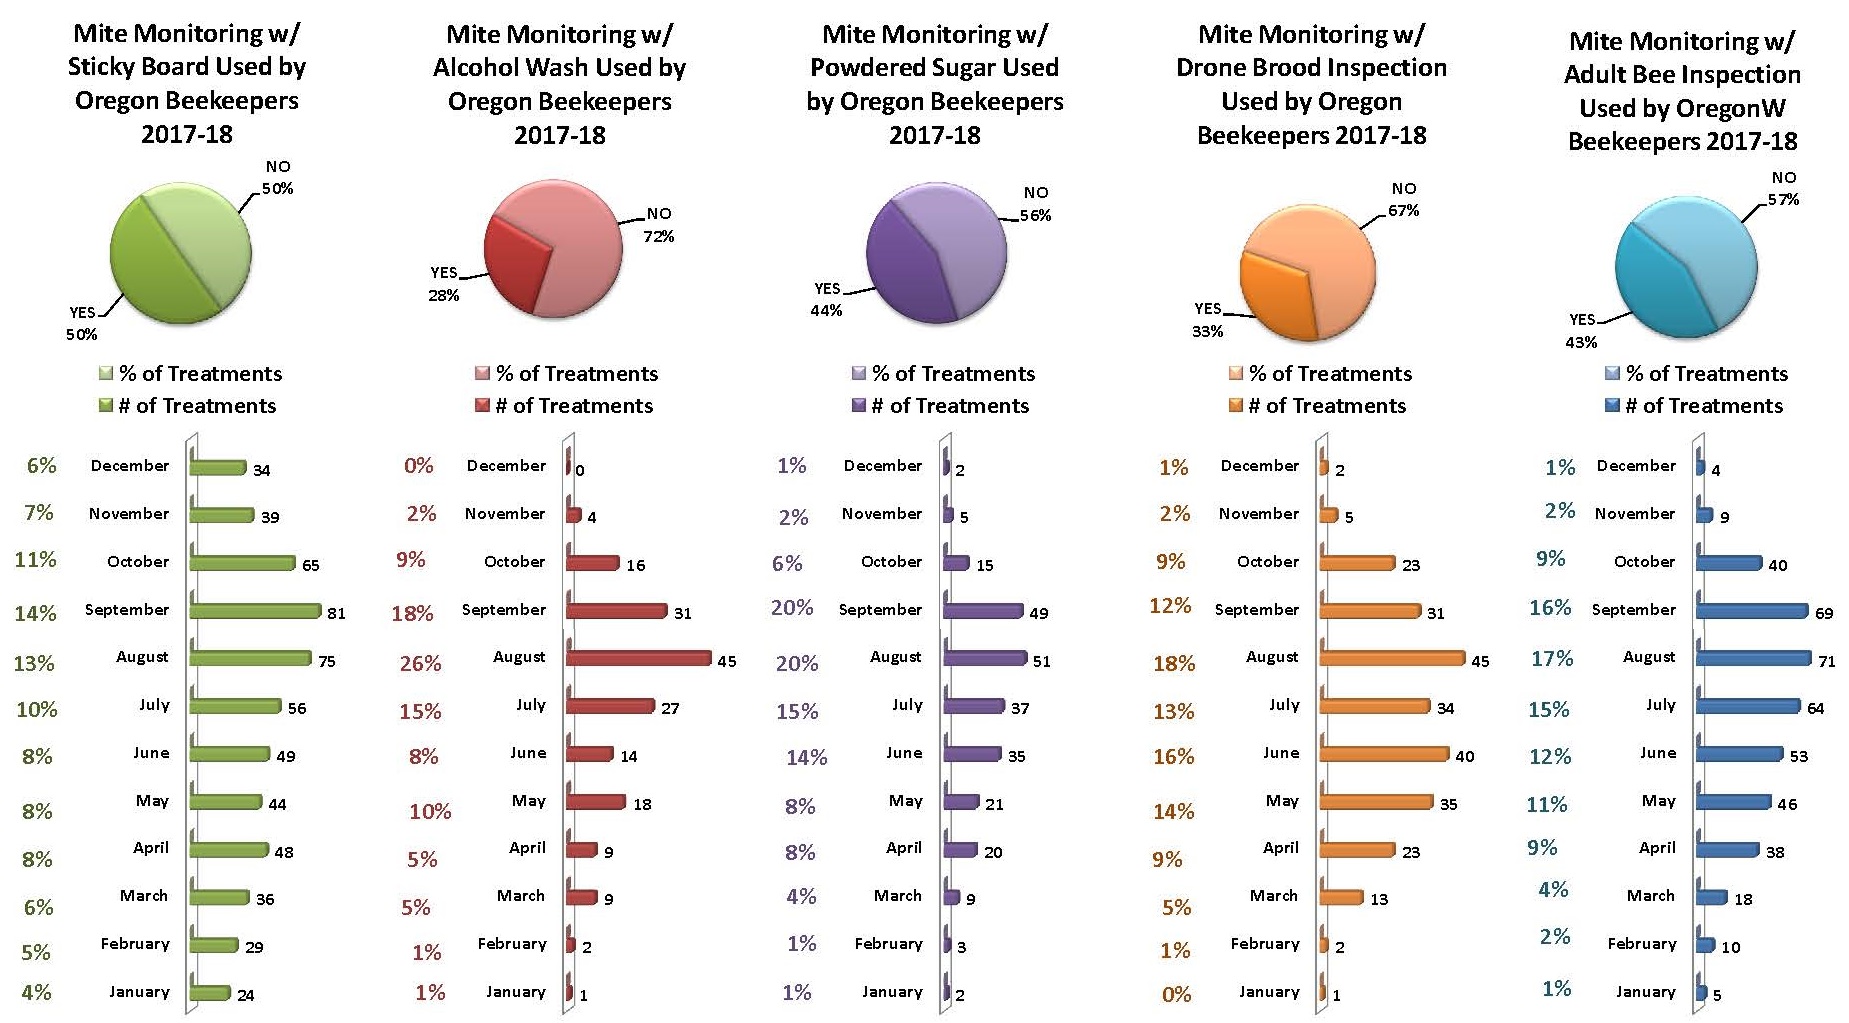
the size of the mite population. Sticky boards are useful to check the treatment efficacy when used post treatment. There use has been decreasing. Most sampling to monitor mites was done in July – September, as might be expected since mite numbers change most quickly during these months and results of sampling can most readily be used for control decisions. See table below for number of months each of 6 sampling months were used.
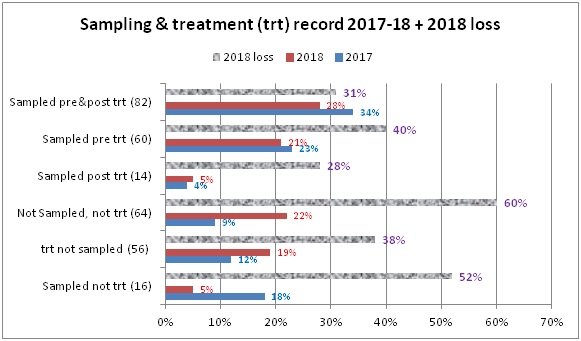
The most common sampling of respondents in 2017-18 was both pre and post-treatment (34%), as was the case last year. Sampling just pretreatment was similar each year but sampling just post treatment, also similar both years, showed a lower loss level similar to both pre and post treatment sampling. Other sampling treatment/sampling combinations exhibited higher loss levels than the overall mean (38%). Neither sampling nor treating had the highest loss level (60%) with sampling and not treating (52%) also with a loss level above the mean. Both these selections showed the greatest 2-year variation.
It is important to KNOW mite numbers. Less effective mite monitoring methods include sticky (detritus) boards below the colony (often so much detritus drops onto a sticky board that picking out the mites can be hard, especially for new beekeepers). Visual sampling is not accurate: most mites are not on the adult bees, but in the brood. Even looking at drone brood is not effective; if done, look at what percentage of drone cells had mites.
See Tools for Varroa Monitoring Guide www.honeybeehealthcoalition.org/varroa on the Honey Bee Health Coalition website for a description of and videos demonstrating how best to do sugar shake or alcohol wash sampling. The Tools guide also includes suggested mite level to use to base control decisions based on the adult bee sampling. A colony is holding its own against mites if the mite sample is below 2% in spring (i.e. 2 mites/100 adult bees) and below 5% (no more than 5 mites to 100 adults) when at its largest size during nectar flow following buildup. It is critical to not allow mite levels to exceed 2-3% during the fall months when bees are rearing the fat fall bees that will overwinter. It is also the most difficult time to select a control method (if one is deemed needed) as potential treatment harm may negatively impact the colony. We are seeing more colonies suddenly disappear (abscond?) during the fall, which may be related to the treatment itself.
Mite control treatments
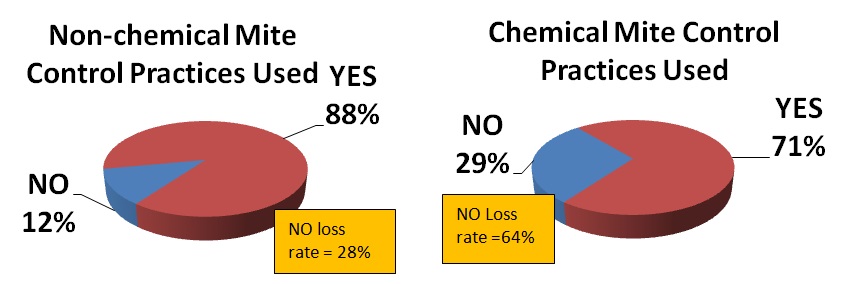
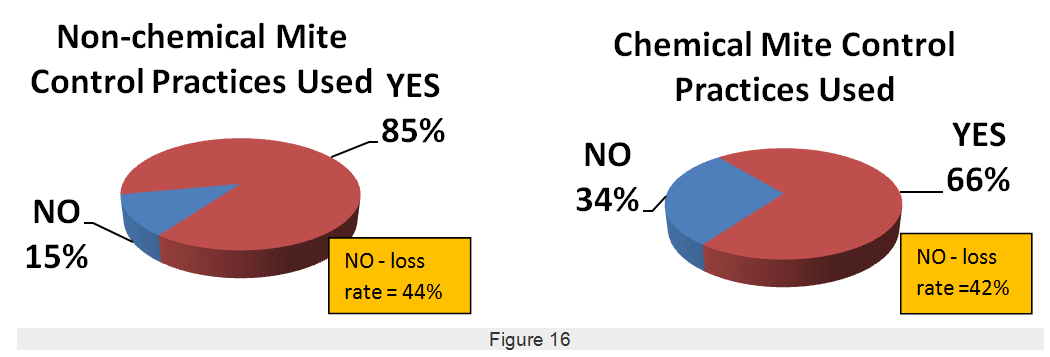
The survey asked about non-chemical mite treatments and also about use of chemicals for mite control. Thirty six individuals, one more than last year (14.5%) said they did not employ a non-chemical mite control and 90 individuals (29%) did not use a chemical control. See Figure 18. Those who did not use a non-chemical treatment reported a 28% winter loss, a lower loss rate than those who did use a non-chemical control. This paradox is explained perhaps by individuals relying too heavily on those control techniques. In contrast those who did not use a chemical had a 63.5% loss rate, up slightly from the previous year (61%) compared to overall loss rate of 38%. The individual options are discussed below. Clearly varroa mite control can make a difference.
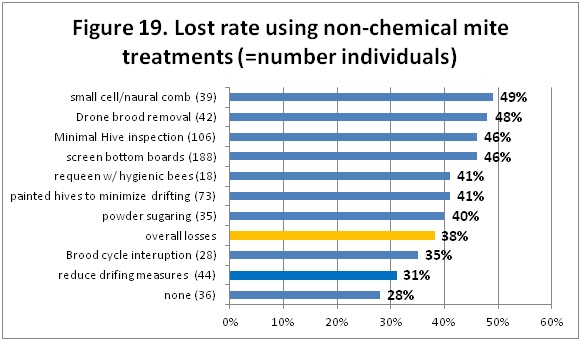
Non-Chemical Mite Control: Of nine non-chemical alternatives offered on the survey (+ other category) use of screened bottom board was listed by 188 individuals, down 12 from previous year. The next most common selection was minimal hive inspection (114 individuals). The use of the remaining 7 selections are shown in Figure 19 as number in ( ). Under other, 6 individuals listed treatment such as oil/sugar mix, soya/garlic mix, local queens, isolation, wild swarm captures and limiting hive size.
Other than doing nothing (10 percentage points lower losses level in both of past two survey years), two of the non-chemical alternatives , brood cycle interruption (28 individuals, loss level 35% and managements to reduce drifting such as spreading colonies in apiary (44 individuals, 31% loss) had losses below the overall loss rate.
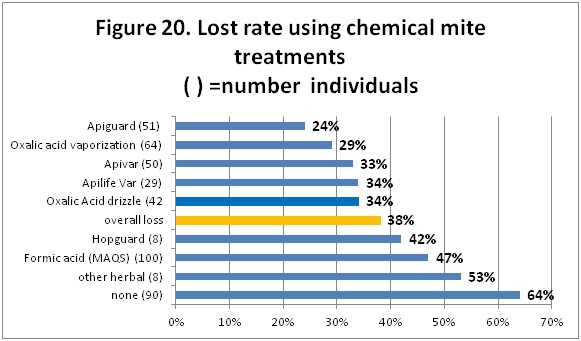
Chemical Control: For mite chemical control, 100 OR Beekeepers (47% of total chemical uses) indicated they most commonly utilized MAQS, formic acid, (down 10 individuals from last year) followed distantly by Oxalic acid vaporization (64 individuals, 30%), Apiguard (essential oil thymol, indicated by 51 individuals, 24%) and Apivar (amitraz), used by 50 individuals (24%), 3 more than last year. Figure 20 illustrates number of uses ( ) and bar length indicates the loss rate for those using that chemical.
Apiguard had the lowest loss rate of 24% of all the chemical choices, 14 percentage points lower than the overall loss rate of 38%. It was used by 51 individuals (up 3 individuals from last year); last year it had a loss rate of 38%, which was 10 percentage points lower than overall rate. Oxalic acid vaporization use increased this year (64 individuals compared to 38 last year) and loss rate was 9 percentage points below overall (last year 14 percentage points below overall). Apivar also had a low loss rate by users of 35% but this was elevated compared to the previous 2 survey seasons (27% loss 2016-17 and 23% loss rate 2015-16). Oxalic acid drizzle use was higher this year (42 individuals compared with 27 last year) and loss rate indicates like vaporization it can reduce loss rate (4 percentage points below overall this season: last year 7 percentage points lower). Its use continues to grow in popularity each survey season; in 2015-16 20% (both methods) to 50% of users. ApiLife Var, used by 29 individuals (increase from 16 last year) had a loss rate of 34% (10 percentage points greater than last year but still did well.
Chemical use was 2.3/individual. 104 individuals (48.5%), 3.5 percent fewer than last year indicated use of a single compound, 33% used two, up 4 percentage points from last year, 16% used three (last year 15%) and only 4 individuals used 4 and one used 5 chemical treatments. The individual that used 5 had zero losses and the 4 that used 4 had 9.5% losses.
MAQS (formic acid), other herbal treatments and Hopguard II users all had losses heavier than overall. Hopguard II has performed poorly in reducing losses. Eight individuals reported its use and had a 42% loss this season [3 of the 8 used only Hopguard as their chemical treatment (they used non-chemical treatments) had a 69% loss rate). Ten used it last year and had a 66% loss rate.
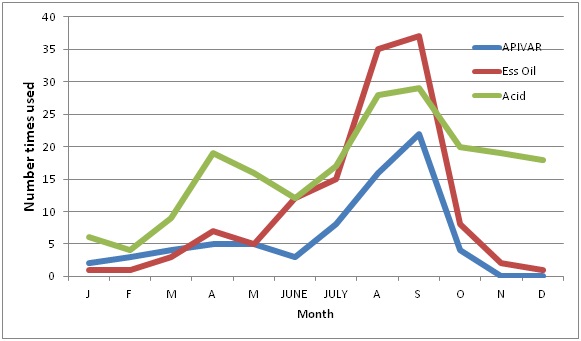
The monthly use of Apivar (blue line), essential oil (red line) or an acid (green line) is shown in Figure 21 for 2016-17 season. Further review is needed to determine if the timing of treatments was more effective than at other times for the various chemicals
Antibiotic use
Thirteen individuals (4%) used Fumigillan (for Nosema control); their loss rate was 52%. Two individuals (one less than last year) indicated use of terramycin.
Queens
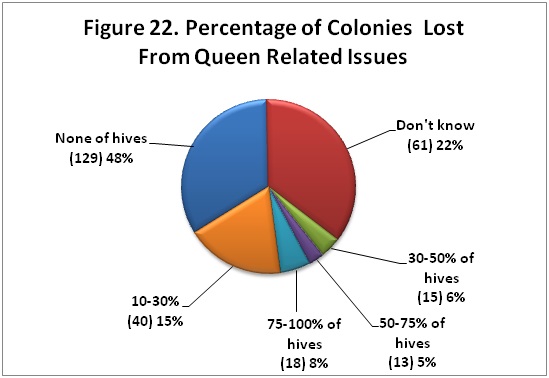
We hear lots of issues related to queen “problems”. Recall under the questions asking the reasons why colonies didn’t survive that 62 individuals, 17% believed queen failure as one of their selections. In Section 8 of the survey we asked what percentage of loss could be attributed to queen problems. 48% (129 individuals, an increase of 11 from last year), said none and an additional 61 individuals (70 last year), (22%) said they didn’t know. Of those 81 individuals (slightly greater number than chose to indicate this was a possible reason for winter loss in the other question), 15% said queen failure could have been responsible for 10-30% of their loss; other responses were very close, form 5 to 7%. Number of individuals, in ( ), and percentage of estimate of loss rate is shown in pie chart Figure 22.
Queen events can be a significant factor contributing to a colony not performing as expected. We asked if you had marked queens in your hives. Eighty one (up 7 from previous survey year) (29%) said yes. The related question then was did you or your bees replace their colony queen? Forty-three percent (121 individuals) said yes, 36% said no and the remainder was ‘not that that I am aware of.’ Figure 23.

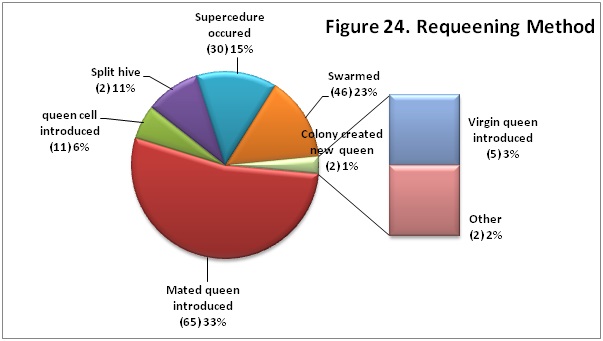
One technique to reduce mite buildup in a colony is to requeen/break the brood cycle. The question “How did bees/you requeen“ received 197 responses (more than one option could be checked) as illustrated in Figure 24. Over one-third of respondents indicated their bees were requeened with a mated queen. Bees did their own requeening more commonly via swarming than supersedure according to respondents. Other responses are shown in Figure 24. The two other responders said they introduced brood form selected colonies and eliminated all other queen cells so the bees would rear queens of their selection.
Closing comments
This survey is designed to ‘ground truth’ the larger, national Bee Informed loss survey. Some similar information is additionally available on the BeeInformed website www.beeinformed.org and individuals are encouraged to examine that data base as well. Reports for individual bee groups are customized and posted to the PNW website.
We intend to continue to refine this instrument each season and hope you will join in response next April. We have a blog on the pnwhoneybeesurvey.com and will respond to any questions or concerns you might have.
Thank You to all who participated. If you find any of this information of value please consider adding your voice to the survey in a subsequent season.
Dewey Caron and Jenai Fitzpatrick, June 2018
Washington backyard beekeeper Winter Losses 2017-18 Dewey Caron
One hundred four Washington beekeepers supplied information on winter losses and several managements related to bee health with an online honey bee survey. Overwintering losses of small scale Washington beekeepers was reduced from the previous elevated loss levels in 2016-2017 of 63% to 44% this past winter.
Figure 1 shows total Oregon (OR) and Washington (WA) response by local association. Statewide loss level is highlighted. Number individuals ( ) to left of association name is number of repondents, bar length is % overwinter losses by club. Total fall colony response was 303 OR and 104 WA individuals; survey includes 1277 OR colonies (789 surviving = 38% loss) and 457 WA colonies (256 surviving = 44% loss).
The WA respondents to the electronic survey were a mixture of single digit colony numbers and others with more colonies and of new beekeepers mixed with more experienced individuals. Thirty seven percent (37%) of WA respondents had 1 or 2 years of experience; 28% had 3 to 4 years’ experience (medium number = 3). 10 individuals (12%) had 5 to 7 years, 10% had 7 to 10 years and 12% had 14+ years of experience, [4 individuals above 30 years]; highest was 55. For fall colony numbers, 40.5% had 1 to 2 colonies, 26% had 3 or 4 colonies (medium was 3 colonies/individual), 19% had 5, 6 or 7 colonies, 8% had 8, 9 or 10 colonies and 7% had 12+ colonies; largest number was 35 colonies. Of the last 7% (>12 years’ experience) there was 17.5% average years of experience and average of 6 colonies lost/individual.
Seventy one (73%) of WA beekeepers had an experienced beekeeper mentor available as they were learning beekeeping. This percentage was up from 62% the previous year.
2017-2018 Overwinter Bee Losses
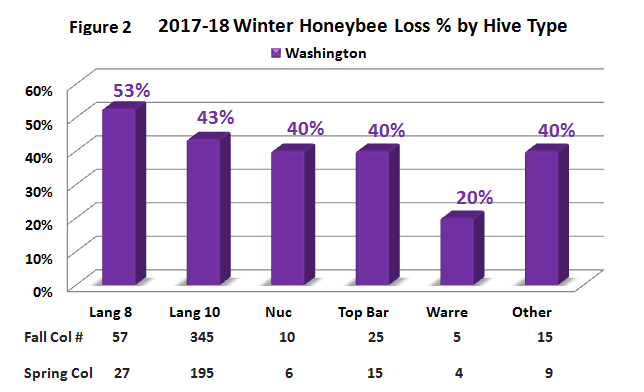
Total WA backyard beekeeper overwinter loss = 44% loss.
The WA survey overwintering loss statistic was developed by our asking number of fall colonies and surviving number in the spring by hive type. Results, shown in Figure 2 bar graph, illustrate overwintering losses for 104 total WA beekeeper respondents. Langstroth 8 and 10 frame beehives (88% of total) had heavier losses than 5 frame nucs (40% loss) and alternative hives. Total alternative – non-movable comb =10%). Other hive types Identified included long hives, tree hive and skeps plus others not specifically IDed. The previous year overall WA colony loss was 63%.
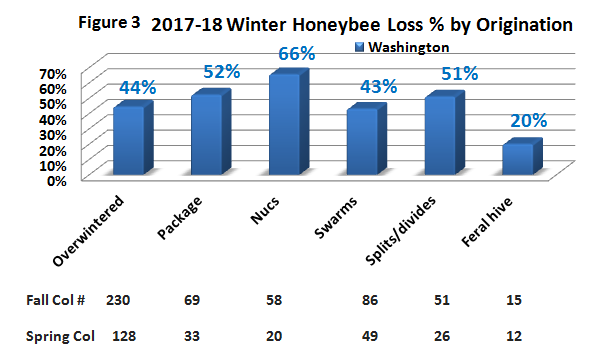
Origination: We also asked about hive loss by origination. Data shown in Figure 3. Overwintered colonies and swarms had better winter survival than did packages, nucs and splits. Feral colonies exhibited the best survival rate, although few in number.
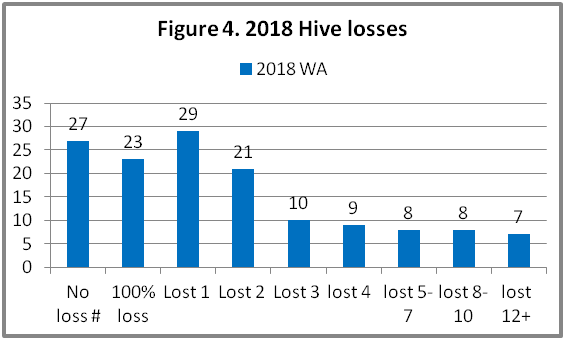
Among 101 total WA beekeepers (4 individuals were new beekeepers), 15 individuals (15%) maintained more than one hive type. For the total WA beekeepers, 27 (27%) had no loss and 23 individuals (23%) had total loss. Twenty-nine WA individuals lost 1 colony, 21 individuals lost 2 colonies and 10 individuals lost 3 colonies (60% of individuals with losses). Seven (7) individuals lost 12 or more colonies; highest loss was 20 colonies. Data in Figure 4.
Comparison of backyarders and commercial/semi-commercial beekeepers
A different (paper) survey instrument was mailed to Pacific Northwest (PNW) semi-commercial (50-500 colonies) and commercial beekeepers (500+) asking about their overwintering losses. Comparison is shown in Figure 5 below with approximate number of colonies represented by the commercial/semi-commercial beekeepers and number of individual backyarder survey respondents.
Backyard losses have consistently been higher, most years double the losses of larger-scale beekeepers. The reasons for this dichotomy are complex. Commercial and semi-commercial beekeepers examine colonies more frequently and they examine them first thing in the spring as they take virtually all of their colonies to Almonds in February. They also are more likely to take losses in the fall and are more pro-active in varroa mite control management.
Self-reported “reasons” for colony losses: We asked survey takers who had winter losses for the “reason” for their losses. More than one selection could be chosen. In all there were 156 WA selections (1.5/individual) provided. Weak in the fall (21 individual choices), poor wintering conditions (19 choices), Varroa mites (18 individuals) and queen failure (21 individuals) were the major factors listed, closely followed by don’t know (16 individuals). The side bar shows other selections.
There is no easy way to verify reason(s) for colony loss. Colonies in the same apiary may die for different reasons. Doing the dead colony examination (necropsy) is the first step in seeking to solve the continuing heavy loss problem. More attention to colony strength and checking stores to help avoid winter starvation will help reduce some of the losses. Control of varroa mites will also help reduce losses.
Respondents were asked to select an acceptable loss level, being offered several categories to check. Four individuals said zero, while 8 said 10% (25% for both responses) 19 said 25%, medium number (40%), 5 said 33% and 9 said 50% loss (19%) was acceptable. One individual each said 75% and 100% (4%) each.
Why do colonies die? There appears to be no single reason for loss and a good deal of variance in opinion as to what might be an acceptable loss level. We are dealing with living animals which are constantly exposed to many different challenges, both in the natural environment and the beekeeper’s apiary. Major factors are thought to be mites, pesticides, declining nutrition adequacy of the environment and diseases, especially viruses and Nosema. Management, failure to do something or doing things incorrectly, remains a factor in our losses.
What effects our alteration to the bee’s natural environment and other external factors play in colony losses are not at all clear.
Langstroth wrote about the importance of taking winter losses in fall management saying if the beekeeper neglects such attention to his/her colonies 45% loss levels may occur, depending upon variable environmental conditions. It can be argued that losses of 30, 40, 50% or more might be the new “normal.” Older, more experienced beekeepers recall when loss levels were 15% or less. Honey production fluctuates each year but, once again, seem to be declining on average. Numbers of U.S. bee colonies have declined since the 1940s, returning to numbers for 100 years ago, although numbers for the last 3 decades have not changed. Worldwide numbers of bee colonies are steadily increasing.
So there is no simple answer to explain the levels of current losses nor is it possible to demonstrate that they are excessive for all the issues facing honey bees in the current environment.
Pro-active Managements: Do you feed bee colonies in your care with sugar, honey or protein? Do you take extra measures for wintering preparation? Are we doing the sanitary practices we would in animal husbandry with our bees such as cleaning hive tools/frequently washing gloves (if used) between inspecting different hives or, when we find it necessary to take a frame from one colony to another do you check to confirm the donor colony is healthy?
Part 2 of the loss survey asks some basic questions to allow comparison of loss rates from beekeepers who may perform one management with those who don’t do that management or with the average loss level. Analysis is of a single factor equated to losses but beekeepers do not normally do only a single management. The analysis is not cause and effect but rather a snapshot of losses related to what some beekeepers do for their colony management.
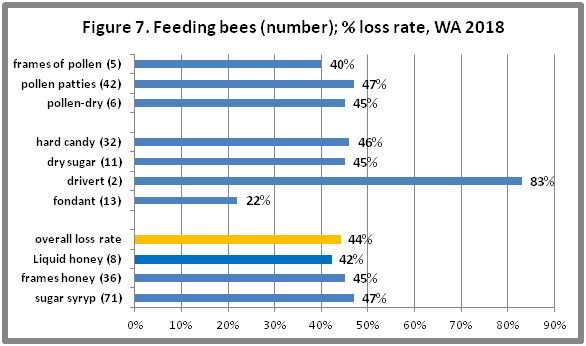
FEEDING PRACTICES: There were 231 selections of feeding managements by Washington beekeepers (2.7/individual). One individual made 6 selections (had zero loss) and 7 had 5 selections; their loss rate was 33%. Twelve had a single selection, 26 made 2 selections, 23 had 3 choices and 16 made 4 choices. Feeding bees carbohydrate in form of sugar syrup was indicated by 71 individuals (83% of individuals who had selections), frames of honey by 36 individual respondents (42%), feeding of hard sugar candy was done by 32 individuals (38%); Pollen patties were fed by 54 individuals (63%) with remaining managements by 13 or fewer individuals.
Only a single management, feeding of fondant by 13 individuals, showed improved survival. In contrast last year, feeding of hard sugar candy and the 4 individuals that fed pollen (2 as dry pollen (14% loss) and 2 as pollen frames, 33% loss) had better overwintering success compared to the average WA loss last year of 55%.
Oregon beekeepers that fed honey (133 total) had 30% loss in 2017-18 survey (overall loss was 38%) and Individuals that fed non-liquid sugar collectively had a lower loss level of 32%. Best survival was with feeding of hard candy (60 individuals, 23% winter losses) and, as with Washington beekeepers, feeding of fondant sugar feeders had lower losses (54 OR individuals fed fondant with a 30% loss level). Protein feeding did not improve winter survival of Oregon beekeepers, nor those in Washington, though it might be useful for colony development or preparing for winter with fall feeding.
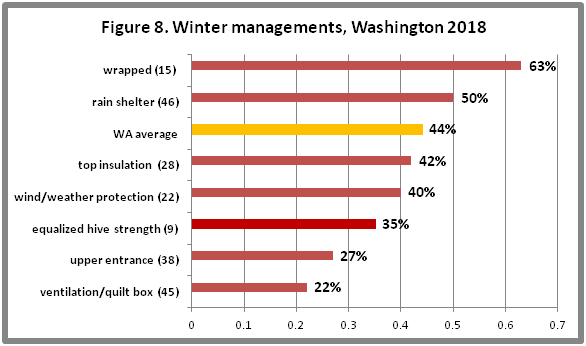
WINTERING PRACTICES: We received 211 responses about WA beekeeper wintering management practices (more than one option could be chosen). Twelve individuals (14%) percent of the respondents indicated none of the several listed wintering practices was done; these individuals had a 49% winter loss compared to overall of 44%. Twenty individuals (23.5%) had 1 selection, 40 had 2 selections (47%), 16 individuals had 3 choices and there were 8with 4 selections and 3 with 5; of those with 4 or 5 selections their loss rate was 33%.
The most common wintering management selected (46 individuals) was a rain shelter followed by ventilated (quilt) box/Vivaldi board at colony top 43 individuals and upper entrance 38 individuals. Figure 8 shows number of individual choices and percent of each selection.
Two selections, rain shelter and wrapping did not seem to improve overwintering success but the remaining 5 winterizing managements all did. Respondents using a ventilation (quilt) box, also called a Valvaldi board, had ½ the losses of overall. For the 303 Oregon survey respondents, use of an upper entrance, equalizing hive strength (both 31%) and wrapping (33% loss) were managements that showed higher survivorship (overall loss rate was 38%). Use of a ventilation (quilt) box, among the most useful managements the previous year, was not among the managements with the lowest loss level this past season.
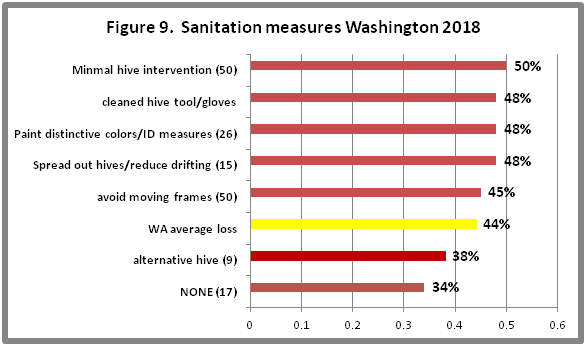
SANITATION PRACTICES: It is critical that we practice some basic sanitation (some prefer use of term bee biosecurity) in our bee care. We can do more basic sanitary practices to help insure healthy bees. Seventeen individuals (18%) did not select any of the options listed under sanitation practices; they had a 34% loss rate. A total of 183 selections were marked (2.35/individual), 27 individuals had a single selections, 25 individuals had 2 selections, 17 individuals had 3 selections, 6 had 4, 2 had 5 and 4 had six selections. Those 4 individuals with 6 selections had a 40% loss level. Minimal hive intervention (53 individuals – 68%) was the most common option selected and avoid moving frames (50 individuals – 64%) was also commonly indicated. Only none and alternative hive selections had loss levels below the overall level. For Oregon beekeepers those doing none also had lower losses as did reduce drifting by spreading colonies out and providing hives with distinctive colors –ID & other hive ID measures. Last year, providing hives with distinctive colors showed slightly lower loss rate.
SCREEN BOTTOM BOARDS: Although many beekeepers use SBB to control varroa, BIP and PNW surveys clearly point out they are not a very effective varroa mite control tool. In this recent survey 13 individuals (12.5%) said they did not use screen bottom boards. In 4 PNW (OR and WA beekeepers) survey years 21% said they did not use SBB and 79% did use SBB on some or all of their colonies. See Figure to right of Washington SBB use this past season. The 13 individuals who did not use SBB actually had a slightly lower loss (41%) compared to those who used on some or all of their colonies (44%). The four year average of SBB use by PNW beekeepers 41.3% loss level of those using SBB on all or some of their colonies and 43.4% for those not using SBB (a 5% positive gain) illustrates how SBB are very minor in improving overwinter survival.
We asked if the SBB was left open (always response) or blocked during winter. This past season 40% of individuals said they always blocked SBB during winter. They had 225 colonies in the fall and lost 135 for a 40% loss rate. Thirty six individuals (35%) blocked them during winter (never response). They had 140 colonies in the fall and lost 72=49% loss rate. Ten individuals (10%) blocked them on some of their colonies. Their loss rate was 44%. Comparing the always closed and never left open responses reveals a 9 percentage point difference in favor of closing the SBB over the winter period. See Figure 11. 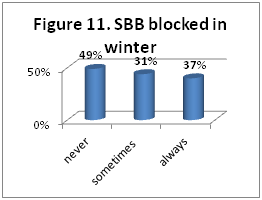
There is no good science on whether open or closed bottoms make a difference in overwinter but some beekeepers “feel” bees do better with it closed overwinter. Four years of comparison of PNW beekeepers shows those closing the screen during winter did have a 10 percentage point improvement in colony survival. An open bottom, at least during the active brood rearing season, can assist the bees in keeping their hive cleaner.
Things that seem to improve winter success: It should be emphasized that these comparisons are correlations not causation. They are single comparisons of one item with loss numbers. Individual beekeepers do not do only one management option nor do they necessarily do the same thing to all the colonies in their care. We do know moisture kills bees, not cold, so we recommend hives be located in the sun out of the wind. If exposed, providing some extra wind/weather protection might improve survival.
Feeding, a common management, has shown to be of some help in reducing losses. However only feeding fondant sugar (13 individuals) had a lower loss level this past year for Washington beekeepers. In contrast last year, feeding of hard sugar candy and the 4 individuals that fed pollen (2 as dry pollen (14% loss) and 2 as pollen frames, 33% loss) had better overwintering success compared to the average WA loss last year of 55%. Oregon beekeepers that fed honey and Individuals that fed non-liquid sugar collectively had a lower loss level . Protein feeding did not improve winter survival of Oregon or Washington beekeepers, though it might be useful for colony development or preparing for winter with fall feeding.
Doing some winter managements did seem to help improve survival. Respondents using a ventilation (quilt) box, also called a Valvaldi board, had ½ the losses of overall. For the 303 Oregon survey respondents, use of an upper entrance, equalizing hive strength (both 31%) and wrapping (33% loss) were managements that showed higher survivorship (overall loss rate was 38%). Use of a ventilation (quilt) box, among the most useful managements the previous year, was not among the managements with the lowest loss level this past season in Oregon for unknown reasons.
The sanitation choices did not measuredly improve survival. In fact for both Oregon and Washington respondents those individuals that did nothing had the lowest losses. For Oregon beekeepers those beekeepers who sought to reduce drifting by spreading colonies out and those providing hives with distinctive colors –ID & other hive ID measures had lower losses. Last year, providing hives with distinctive colors showed slightly lower loss rate.
Replacing standard bottom boards for screened bottoms only marginally improved winter survival. It was advantageous to close the bottom screens during winter.
Mite monitoring/sampling and control management
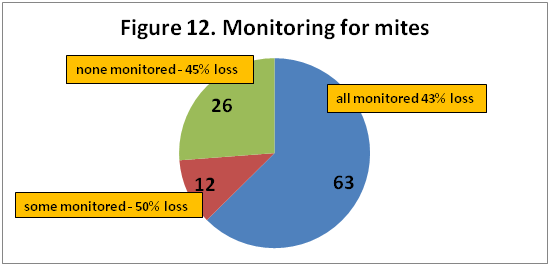
We asked percentage of colonies monitored for mites during the 2016 year and/or overwinter, whether sampling was pre- or post-treatment or both and, of the 5 possible mite sampling methods, what method was used and when it was employed. Sixty three individual respondents (61%), 2 percentage points fewer than the previous year, said they monitored all their hives and when those individuals monitoring was compared to loss, this group had a 43% loss. Twenty six (25%), reported no monitoring and they had a slightly higher loss rate, 45% loss. 12 individuals reported monitoring some of their colonies; they had a 50% loss. See Figure 12. Oregon beekeepers also reported an advantage in monitoring. 184 individuals who monitored had a 38% loss while 77 individuals who did not monitor had a 49% loss. See the pnwhoneybeesurvey site for a report on monitoring for Oregon beekeepers.
When asked how the hives were monitored, the 75 WA individuals who indicated they did monitor had five choices. Twenty-four individuals selected only a single method (12 sticky board, 2 alcohol wash, 2 powdered sugar, 3 drone brood and 5 adults) while the remainder selected two or more methods. Most popular was visual on adults =48 and sticky board 47. Drone brood was selected by 30 individuals, powdered sugar 17 and alcohol wash 14. For the 14 individuals used alcohol wash and 17 using powdered sugar losses of both were respectively
For WA beekeepers the most common response was did not sample or treat (29 individuals, had 48% loss) followed b treated but did not sample (26 individuals, also had 48% loss). Beekeepers sampling both pre- and post-treatment (23 individuals) had 41% loss. Individuals who sample pre-treatment (13 individuals) had 26% loss and those who did only post-treatment (6 individuals) had 27% loss. Six individuals who sampled but did not treat had a 45% loss.
Figure 13 compares sampling/treatment relationships of past two years. The number of individuals varies widely as does the loss averages. Individuals (17 in 2016-17 ad 23 in 2017-18) that sample both before and following treatment had losses below the overall averages (53% in 2016-17 and 44% this past winter but not greatly so. The small number of individuals (3 in 2016-17 and 4 this past survey year) who sampled only post treatment likewise had slightly lower losses both years. Individuals who neither treated nor sampled and those who sampled but did not treat had losses similar to overall losses for their respective years.
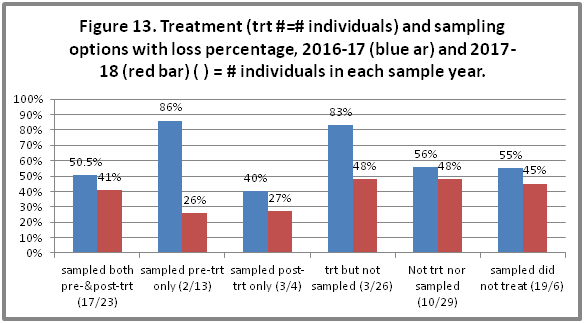
Figure 14 illustrates the sampling methods and when they were performed. Most months are included for all 5 sample methods, except alcohol wash and powder sugar in the winter months. Most sampling is done April to October as expected.
The monthly use of Apivar (blue line), essential oil (red line) or an acid (green line) is shown in Figure 15 for 2016-17 season. Further review is needed to determine if the timing of treatments was more effective than at other times for the various chemicals.

Mite control treatments
The survey asked about non-chemical mite treatments and also about use of chemicals for mite control. Fifteen individuals (15%) said they did not employ a non-chemical mite control and 34 individuals (34%) did not use a chemical control. See Figure 16. Those who did not use a non-chemical treatment reported a 44% winter loss while those not using a chemical control had a 42% loss, both lower than overall Washington beekeeper loss. Last year with those indicating doing nothing had a 10 percentage point lower loss level than the total respondent base. The individual options are discussed below.
Non-Chemical Mite Control: Of nine non-chemical alternatives offered on the survey (+ other category) use of screened bottom board was listed by 66 individuals (0%, up by 11 percentage points from last year). The next most common selection was minimal hive inspection (45 individuals, 55% also higher than last year). The use of the remaining 7 selections are shown in Figure 17; number individuals in ( ).
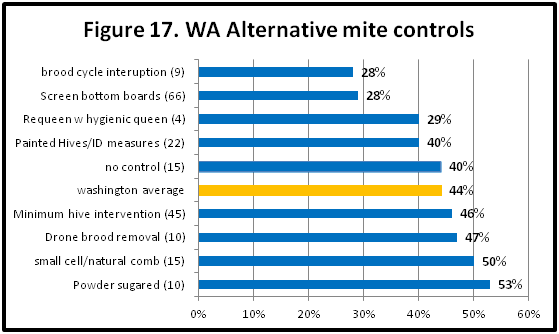
Brood cycle interruption (9 individuals) had the best survival and so did Screen bottom boards. Painting hives a color/distinctive ID measures (22 individuals) and requeening with hygienic queens (only 4 individuals) also seemed to be effective (last year 6 individuals checked this choice and they too had lower losses. powder sugaring (10 individuals) were also popular; the remaining selections were chosen by 6 or fewer individuals. Timing and proper application of alternatives is critical to successful completion. Bees need time to properly prepare for winter following successful mite reduction.
Chemical Control: Thirty-four WA beekeepers did NOT use a chemical control –they had a 47% loss. In all, 49 selections were made (1.1/individual, 7 individuals used 2 chemicals, 4 used 3 materials and one each used 4 and 5 chemical treatments). The choices and the loss rate are shown in Figure 18. Several materials ApiLifeVar, MAQS (formic acid), Apiguard, Apivar and oxalic acid vaporization showed lower losses.
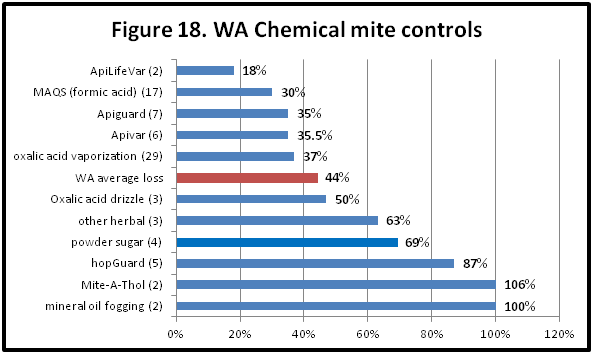
Last year only the 2 WA individuals who used oxalic acid dribble (had no loss of colonies) and those who used MAQS (formic acid) had loses below the average loss. In comparison, for OR beekeepers, Apiguard had the lowest loss rate of 24% of all the chemical choices this past year and It was 10 percentage points lower the previous year. Oxalic acid vaporization use increased this year (64 OR individuals compared to 38 last year) and loss rate was 9 percentage points below overall, the second year it has had losses below the overall level. Oxalic acid drizzle use was higher this year (42 OR individuals compared with 27 last year) and loss rate indicates, like vaporization, that users had reduced loss rate (4 percentage points below overall this season: last year 7 percentage points lower). Finally ApiLife Var, used by 29 individuals (increase from 16 last year) had a loss rate of 34% (10 percentage points greater than last year but still lower than overall.) The reason for the difference between WA and OR beekeepers is unknown.
Antibiotic use
Twelve individuals (12%) used Fumigillan (for Nosema control); their loss rate was 29%. One individual used Nosevet (17% loss rates). Two individuals (one less than last year) indicated use of terramycin. They had 56% loss level.
Queens
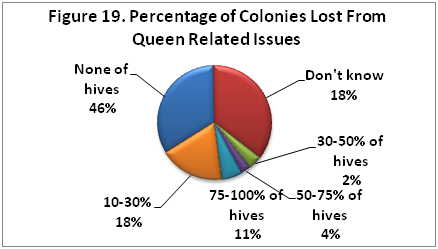
We hear lots from beekeepers who report “ issues” related to queens “problems”. Recall under the questions asking the reasons why colonies didn’t survive, that 21 individuals, 13%, self-reported queen failure as one of their selections. In the survey we also asked what percentage of loss could be attributed to queen problems. 46% (45 individuals) said one and an additional 18 individuals said didn’t know = 64%. Thus 36%, a little more than double from those self-reporting queen failure, said that they lost some colonies from queen failure. The majority, 18 individuals, listed queen issues in 10-30% of their colonies. Eleven individuals listed this as a 75-100% effect. Number of individuals, in ( ), and percentage of estimate of loss rate is shown in pie chart Figure 19.
Queen events can be a significant factor contributing to a colony not performing as expected. We asked if you had marked queens in your hives. Twenty five individuals (26%) said yes. The related question then was did you or your bees replace their colony queen? Forty-four percent (42 individuals) said yes, 38% said no and the remainder was ‘not that that I am aware of.’ Figure 20. 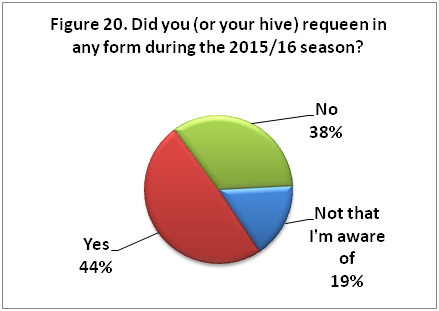
One technique to reduce mite buildup in a colony is to requeen/break the brood cycle. The question “How did bees/you requeen“ received 69 responses (more than one option could be checked). Sixteen percent (16%) of respondents indicated their bees were requeened with a mated queen. Bees did their own requeening more commonly via swarming 26% than supersedure 23% according to respondents. Five individuals said they requeened with virgin queens and 3 with queen cells. Eleven (11) individuals said they did requeening via splitting. Two “other” respondents said they introduced brood from selected colonies and eliminated all other queen cells so the bees would rear queens of their selection.
Closing comments
This survey is designed to ‘ground truth’ the larger, national Bee Informed loss survey. Some similar information is additionally available on the BeeInformed website www.beeinformed.org and individuals are encouraged to examine that data base as well. Reports for individual bee groups are customized and posted to the PNW website.
We intend to continue to refine this instrument each season and hope you will join in response next April. We have a blog on the pnwhoneybeesurvey.com and will respond to any questions or concerns you might have.
Thank You to all who participated. If you find any of this information of value please consider adding your voice to the survey in a subsequent season.
Dewey Caron and Jenai Fitzpatrick, June 2018
****************************************************************
THANK YOU. Bee counted-Bee informed! I hope you find this useful. Please consider participating in the PNW and/or the National BIP survey next April! Help make the Washington state report more robust with an even larger participant base next year.