** Looking for a report in your specific region? Refer to the Individual Club Reports page.
** Scroll down to see the Washington Backyard Beekeepers Winter Bee Loss Report, 2019-20 or click here to view Washington as PDF.
Winter Bee Losses of Oregon Backyard Beekeepers for 2019-2020
by Dewey M. Caron and Jenai Fitzpatrick
Click here to view a PDF of Oregon report.
Overwintering losses of small-scale Oregon backyard beekeepers decreased to 38% this winter after the disastrous level of 48% colony losses the previous winter. This report presents the results of our 11th season of Oregon hobbyist/backyard beekeeper surveys. This annual survey is conducted at www.pnwhoneybeesurvey.com. Herein we discuss the data provided by 302 Oregon beekeepers, which is 114 fewer respondents than last year. Results of the Washington respondents are included in a separate loss report which can be found on our web page along with individual club reports.
Characterization of Survey Respondents
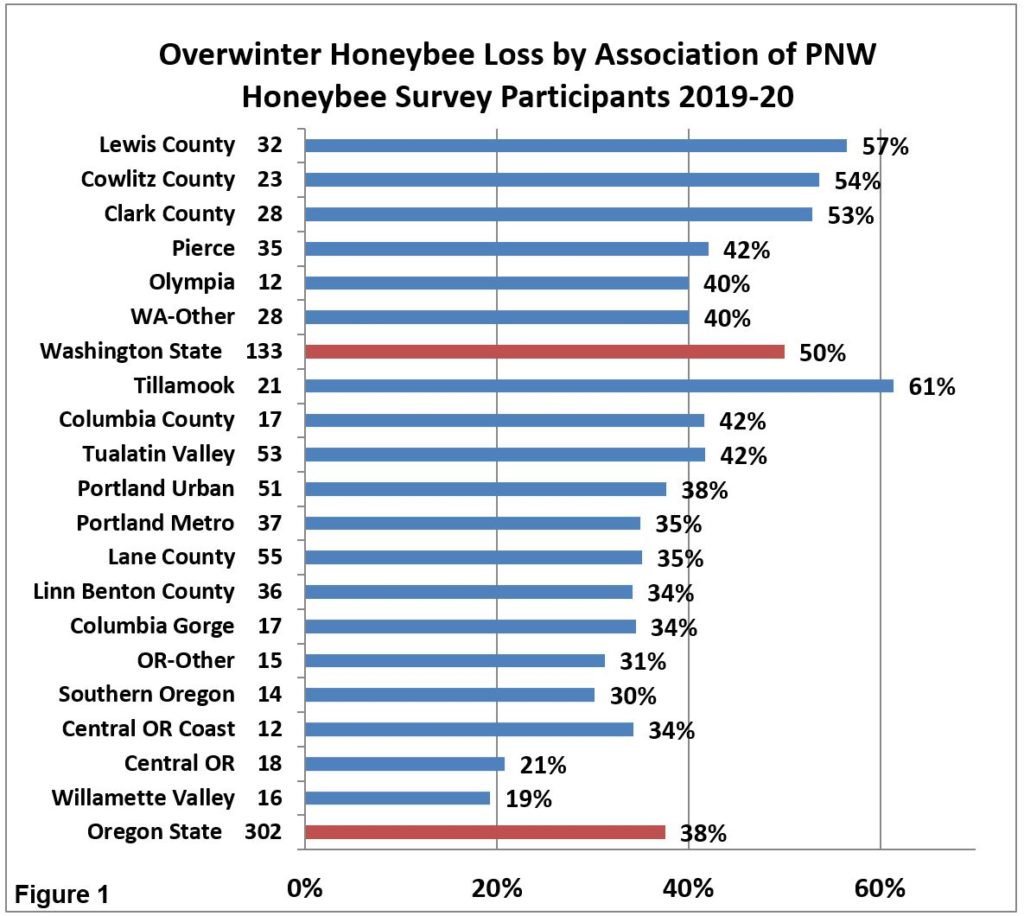
Club results of 12 local Oregon associations and 5 Washington associations are shown in Figure 1. Colony numbers ranged from 1 to 50 colonies in Oregon and 1 to 45 in Washington. The number of respondent individuals is listed next to the association name. The bar length is the average club loss percentage for the year. Three quarters of our Pacific Northwest Honeybee Survey respondents keep bees along the I-5 corridor between Eugene and Tacoma. The “OR-other” includes many beekeepers along the northern coast range, a few in Klamath Falls and north eastern Oregon while the “WA-other” includes several from the Puget Sound/King County area and a few from central and eastern Washington.
2019-2020 Overwinter Losses by Hive Type
The loss statistic was developed by asking number of fall colonies and surviving number in the spring by hive type. Respondents had 1,353 fall colonies of which 845 colonies survived to spring equating to a 62% survival or 38% loss, depending on which way you prefer to view it. Eighty-four percent of hives were 8-frame and 10-frame Langstroth hives which had a survival rate of 63%. Of the forty-one “other” hives indicated on responses, 27 were horizontal or Valkyrie hives, 2 were AZ hives and 2 were called swarms. The remaining twelve were not identified specifically but are likely some form of non-traditional hive, thus, at most 6% of hives were Top Bar, Warré or non-traditional hives. Interestingly seventy individuals (23% of all Oregon beekeepers) kept more than one hive type.
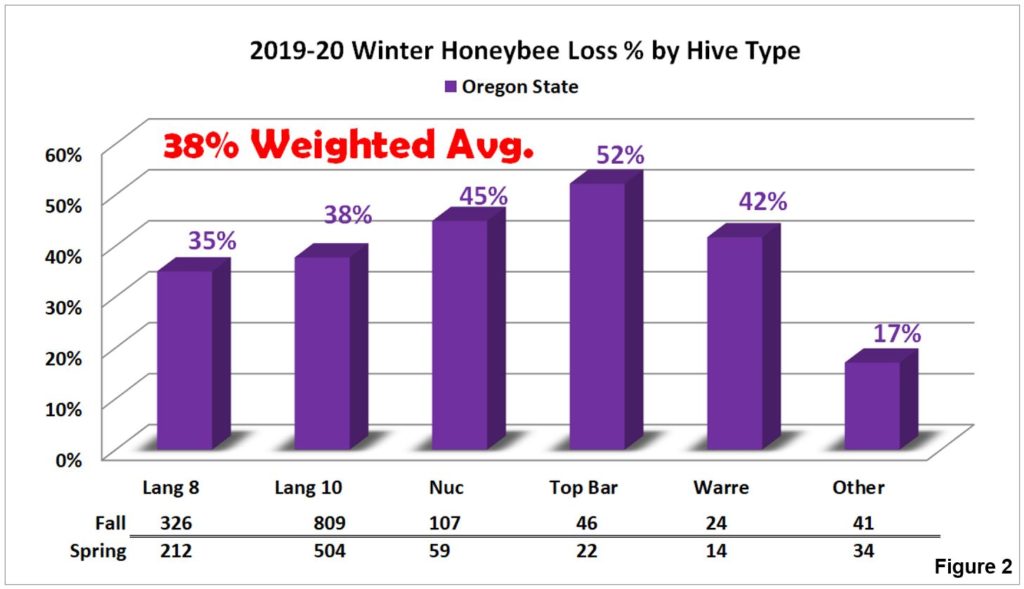
The 35% winter losses of PNW 8-frame Langstroth hives was similar to the 38% loss rate of 10-frame Langstroth hives. The rates in Figure 2 feel slightly better when compared to the 6-year average of 38% and 40% loss respectively. Nuc losses are typically higher than Langstroth but this year came in significantly improved than the Nucs 6-year average of 53%. This year’s Top Bar hive loss improves slightly over the 6-year average loss of 54% but this year’s Warré hive losses tips the scale back to even with its higher loss than the 6-year average of 40%. Although many beekeepers come and go it is interesting that each survey year Top Bar and Warré hives remain steady at slightly over 5% of total hives. As you can see there are many hive types to choose from and we will continue to track them and their associated loss in order to report any significant findings in coming years.
Survival Based on Hive Origination
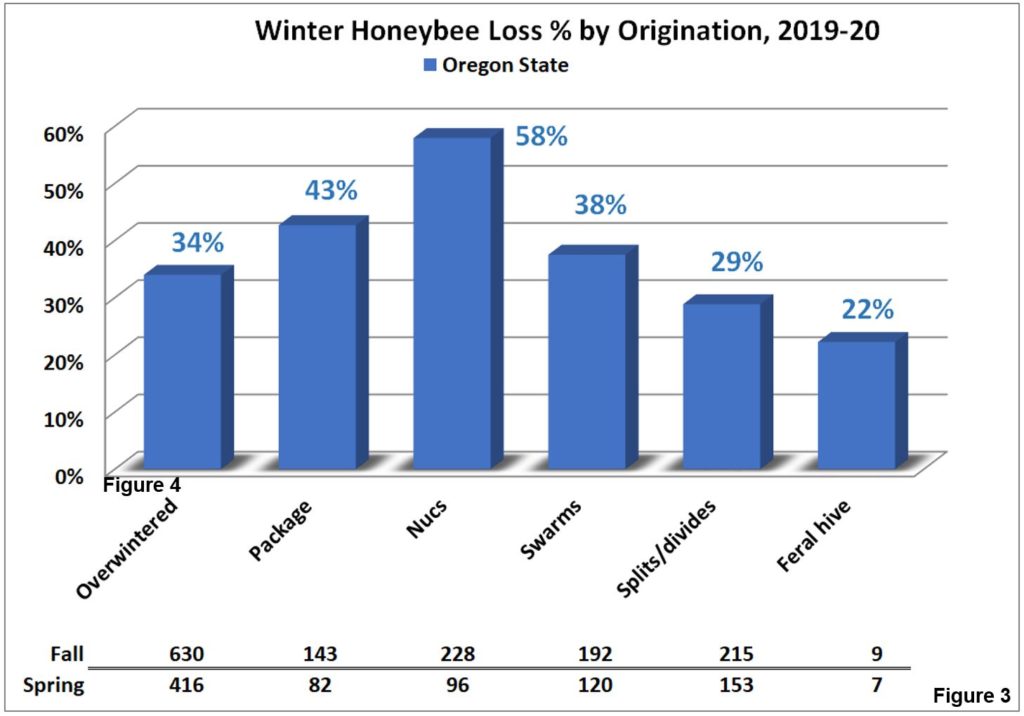
We also asked survey respondents to characterize their loss by hive origination. The result is graphically presented below in Figure 3. Overwintered colonies, swarms and splits/divides all had survival at or lower than the average as did feral hive transfers. Nucs (the 2nd most numerous) and packages in that order had poorer survival than average this past winter. For the past 5 years overwintered hives show lowest loss level (36%) while both packages and nucs average 52% loss for past 5 years. Swarms (45%) and splits (41%) are intermediate.
Three quarters of Oregon beekeeper respondents indicated they had a mentor available for the first years of beekeeping. This is an increase of 5% over last year’s survey. This is encouraging as the learning curve is a steep one for new beekeepers and mentors can significantly help new individuals get through the critical early years of keeping bees.
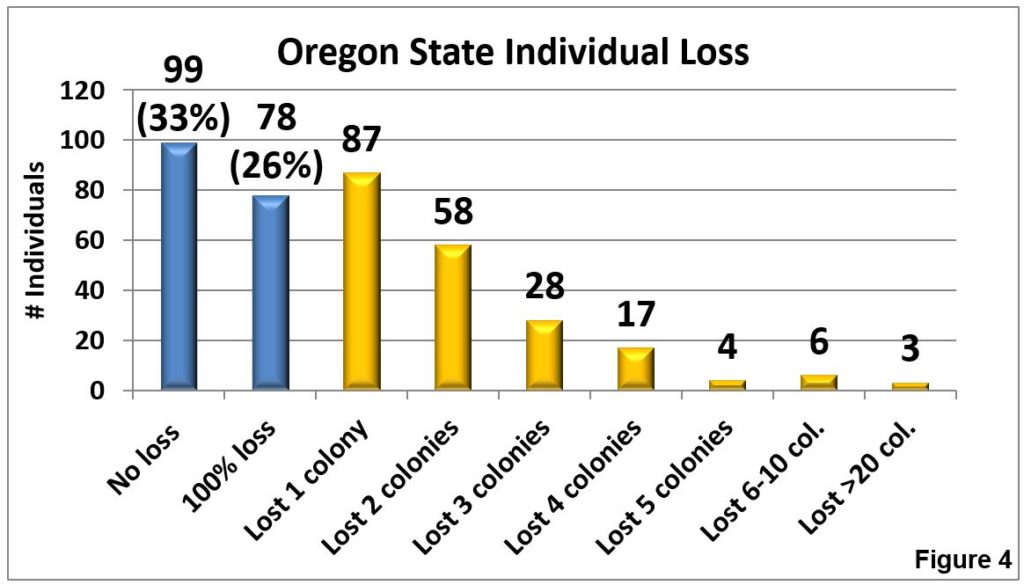
A third (99 individuals) of Oregon respondents had NO LOSS overwinter, whereas slightly more than a quarter (78 individuals) lost 100% of fall colonies. Figure 4 below shows loss of 1, 2, 3, 4 and 5 colonies; the loss of 1 single colony (by 87 individuals) represents 43% of total individuals reporting loss and 57% of the total loss statewide. Nine individuals lost 6 or more colonies. Highest loss by a single beekeeper was 43 colonies. Loss numbers are reflective of the fact that backyarders keep on average 3 colonies. Those individuals with 1, 2 or 3 colonies lost slightly over half of total colony loss statewide (508 colonies) this past winter.
Losses of Individuals who Managed 10+ Colonies
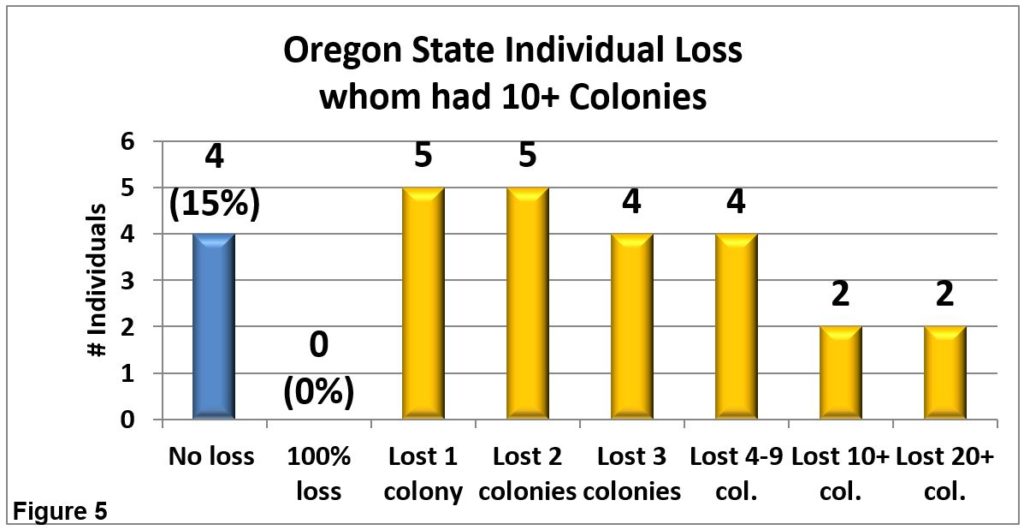
Two hundred seventy-seven (92%) of Oregon beekeepers had 1 to 9 colonies. There were 26 beekeepers (9%) who had more than 10 and up to 50 fall colonies. Collectively these 26 had a 32% loss, 6 percentage points lower than statewide average. As Figure 5 shows, four of these 54 individuals (15%) lost no colonies. Fourteen individuals (61%) lost 1, 2 or 3 colonies. The 54 individuals with 10+ colonies averaged 7 years experience with range of 2 to 52 years experience; 6 individuals (26%) had 20 or more years of experience.
Comparison to Larger-Scale Beekeeper Losses
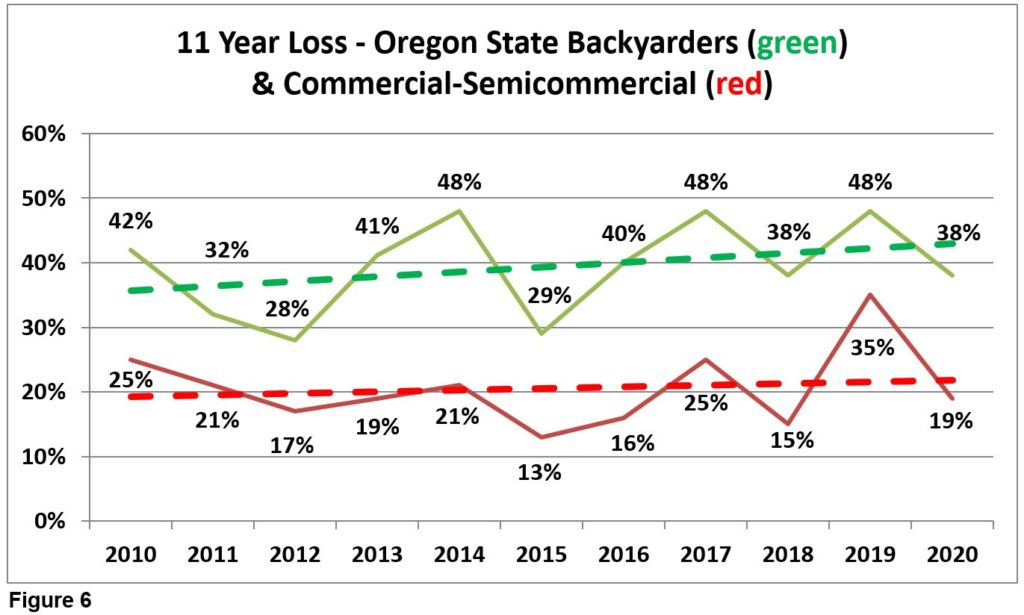
A different (paper) survey instrument was mailed to select Pacific Northwest (PNW) semi-commercial (50-500 colonies) and commercial beekeepers (500+) asking about their overwintering losses. Seven Oregon commercial and six semi-commercial beekeepers (35,068 colonies, approximately 40% of the estimated total number of colonies in the state) reported overwinter losses of 19%. Small scale (backyard) beekeeper losses have ranged from fifteen to 20 percentage points greater compared to losses of commercial/semi-commercial beekeepers over the last 11 years as shown in Figure 6. (11 year average Backyard=39.3% loss and 11 year commercial/semi-commercial loss = 20.7%) Red line is loss trend. Incidentally, the national losses for those respondents from OR with the BeeInformed survey essentially mirror losses of the commercial-semi-commercial losses.
Loss Rates at Different Locations
We asked loss related to location of the hive. Thirty nine individuals had more than a single location. Loss rate at these other apiaries was four and a half percentage points loss rate of these same 39 individuals at their principal apiary. Information supplied on location will be used to develop location density maps, similar to maps prepared by Jenai in 2014.
Overwinter losses of members of different organizations are shown in the Figure 1 above. The loss rates varied from a low of 19% for the Willamette Valley beekeeper respondents to a high of 61% for Tillamook Association. The 4X range of losses, was greater than last year (2X difference or the year before (3X difference)). In 2016 there also was a 4X range difference (20% to 80%).
Who are Survey Respondents?
To better characterize the survey population, we tallied individual number of fall colonies for the 302 respondents. As indicated in the blue bar of Figure 7, sixty individuals had 1 colony, 75 had 2 colonies (the most common colony number) and 49 individuals had 3 colonies (the middle number). Number of individuals with 4-6, 7-9 and 10+ colonies (9% of indiv). Highest colony number was 45.
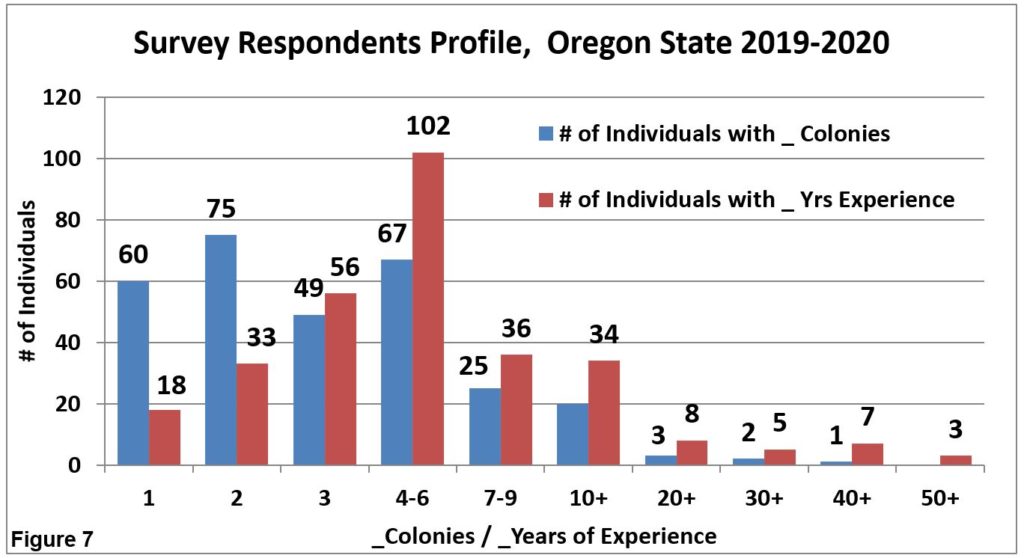
We also asked how many years of beekeeping experience survey respondents had as indicated by the red bars of Figure 7. The medium years of beekeeping experience for Oregon beekeepers was 5 years. A third of respondents indicated 1, 2 or 3 years of experience, another third (102 individuals) had 4, 5 or 6 years’ experience. On other end of spectrum, 57 individuals (19%) had 10+ years experience. 52 years’ experience was the highest.
Colony Movement
Twenty individuals (7%) moved colonies during the year. Reasons listed for move included 3 individuals moving hives a few yards to several feet to improve hive siting, 4 individuals who moved for better forage conditions/better site/protection from pesticides/too many bees in apiary, 1 moved hives to start friend/family, 3 moved bees for pollination, 1 moved from bear predation, and 1 had to move due to loss of site.
Colony Death Perceived Reason and Acceptable Level
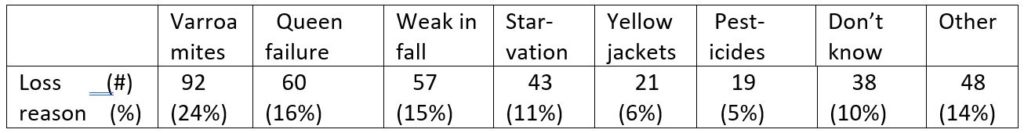
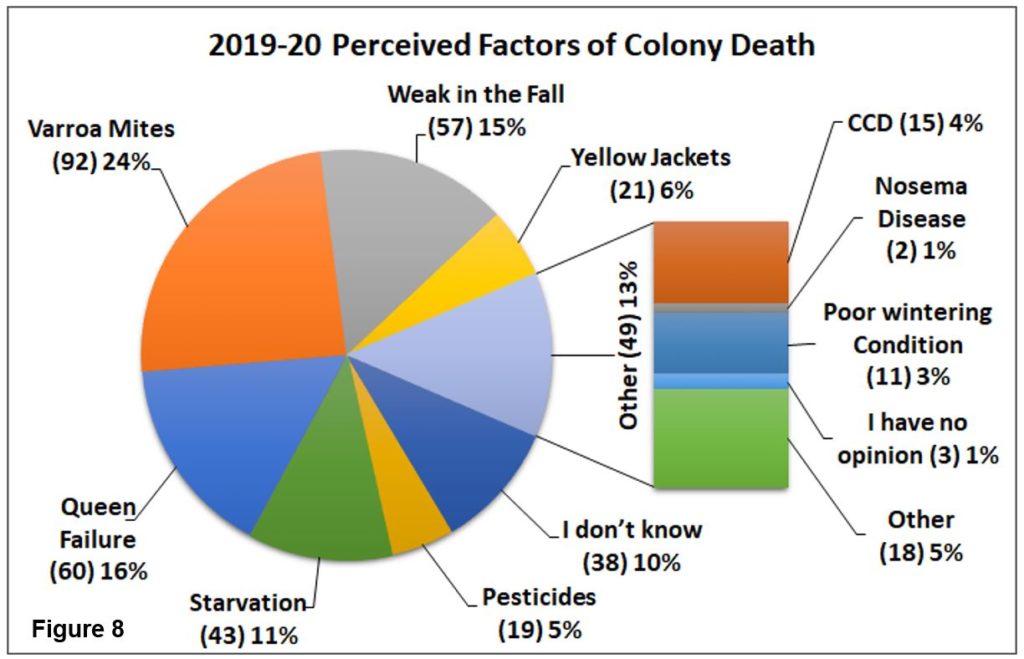
We asked individuals that had colony loss (99 individuals had no loss) to estimate what the reason might have been for their loss (multiple responses were permitted). There were 378 total listings, 1.85/individual. Varroa (24% of respondent choices), followed by Queen failure, weak in the fall and starvation were most commonly checked. 38 individuals chose Don’t know. Among other, 11 individuals listed poor wintering; for 18 other responses 5 were beekeeping error, 4 moisture, 3 late season swarm/absconds and 2 were due to bear attack. Data shown in table and pie chart (Figure 8).
Acceptable loss: Survey respondents were asked reason for loss. Sixty seven (17.5%) indicated zero (no loss). Forty five percent of individuals indicated 15% or less. 20% was medium choice. Thirteen percent said 50% of greater was an acceptable loss level. See table below.

Why colonies die?
There is no easy way to verify reason(s) for colony loss. Colonies in the same apiary may die for different reasons. Examination of dead colonies is at best confusing and, although some options may be ruled out, we are often left with two or more possible reasons for losses. A dead colony necropsy can be of use. Opinions vary as to what might be an acceptable loss level. We are dealing with living animals which are constantly exposed to many different challenges, both in the natural environment and the beekeeper’s apiary. Individual choices varied from zero to 100%, with medium of 20%. This acceptable loss level has crept upwards over time.
Major factors in colony loss are thought to be mites and their enhancement of viruses especially DWV (deformed wing virus), VDV (Varroa destructor Virus (also termed DWV B) and chronic paralysis virus. Declining nutritional adequacy/forage and diseases, especially at certain apiary sites are additional factors resulting in poor bee health. Yellow jacket predation is a constant danger to weaker fall colonies. Management, especially learning proper bee care in the first years of beekeeping, remains a factor in losses. What effects our changing environment such as global warming, contrails, electromagnetic forces, including human disruption of them, human alteration to the bee’s natural environment and other factors play in colony losses are not at all clear.
There is no simple answer to explain the levels of current losses nor is it possible to demonstrate that they are necessarily excessive for all the issues facing honey bees in our and their environment. Varroa mites and the viruses they transmit are considered a major factor, but by no means the only reason, colonies are not as healthy as they should be. More attention to colony strength and possibility of mitigating winter starvation will help reduce some of the losses. Effectively controlling varroa mites will help reduce losses.
Colony Managements
We asked in the survey for information about some managements practiced by respondents. The survey inquired about feeding practices, wintering preparations, sanitation measures utilized, screen bottom board usage, mite monitoring, both non-chemical and chemical mite control techniques and queens. Respondents could select multiple options and there was always a none and an other selection possible. This analysis seeks to compare responses of this past season to previous survey years.
Most Oregon beekeepers do not perform just one management to their colony (ies) toward improving colony health and overwintering success. This analysis however is mainly of a single factor equated with loss level of those same individuals. Such analysis is correlative – doing a similar management as fellow beekeepers does not necessarily mean you too will improve success.
FEEDING: Oregon survey respondents checked 878 feeding options = 2.9/individual. Forty eight individuals (17%), other than those who indicated no feeding, selected a single choice, 56 (20% of respondents) indicated 2 choices, 84 (the greatest number) indicted 3 choices; 11 individuals (4%) had 6, 7 and in one instance, 9 selections for feeding management.
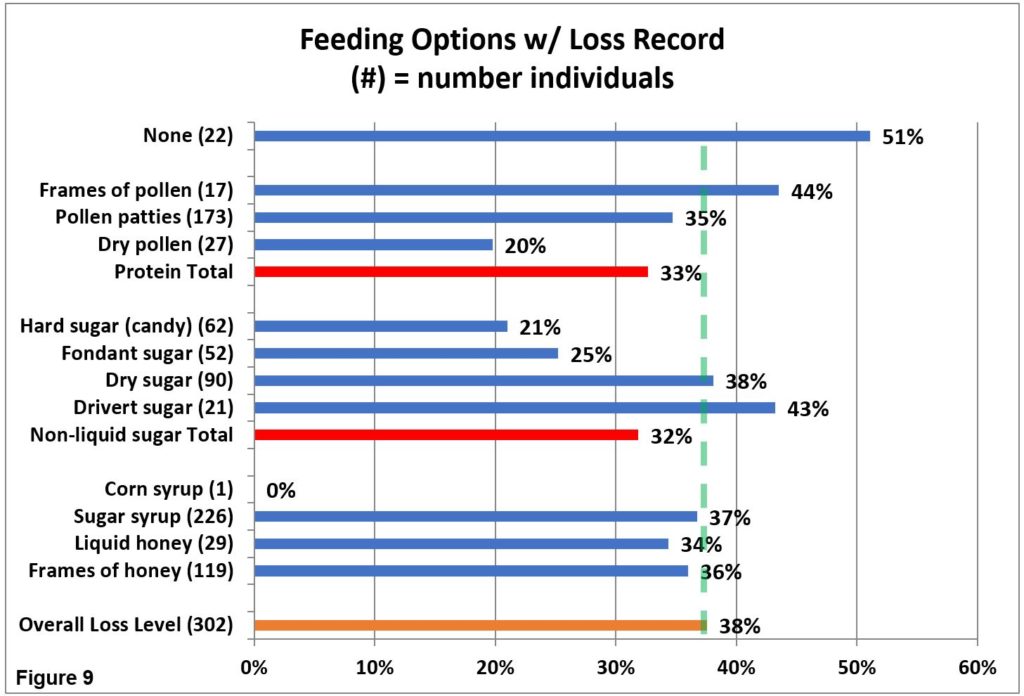
The choices, with number of individuals making that selection is in ( ) in Figure 9; bar length indicates loss level of individuals doing this management. Those bar lengths to left of 38% green dashed marker had better survival while those to right had greater loss level.
Twenty-two individuals (decrease of 7 individuals over previous year) said they did NO FEEDING. They had 52 fall colonies and realized a 51% loss, 8 percentage points higher than overall loss level (same percentage difference as last year). For individuals indicating one or more feeding managements, feeding sugar syrup was the most common feeding option of respondents (226 individuals, 75% of respondents). Their loss rate was 37%, essentially same as overall average. Percent of individuals feeding protein was 58% and non-liquid sugar was 60%; both collectively had slightly better survival rate, although some selections, most notably frames of pollen and drivert feeding, had heavier losses than the average overall loss rate.
Summary: For the last 4 years statewide (average loss rate =43%), individuals doing no feeding had 13 percentage points higher losses (poorer survival) all 4 years (AVERAGE PERCENT DOING NO FEEDING = 8% of individuals, AVERAGE STATEWIDE LOSS 4 YEARS = 55.6%).
Individuals statewide that fed sugar syrup had a 7% lower loss level (average for the 4 years). Those feeding honey (as frames or liquid) had lower loss only during the 2018 and this past winter overwinter period. Individuals feeding non–liquid sugar (in any of the forms) had lower losses all four past winter seasons, with 5 or 6 percentage point improvement from overall losses. Dry sugar feeders had slightly better survival all 4 winters (average= 39%) while hard candy feeders had a much improved survival all 4 winters (=31% average survival); fondant feeders had better survival 3 of the 4 winters (37% 4-year average).
For individuals feeding protein, only the protein patty users showed better survival all 4 years; dry pollen feeders had much better survival in two of the four years with losses the remaining two years close to the overall yearly average.
WINTERING PRACTICES: We received 651 responses (2.6/individual) about OR beekeeper wintering management practices (more than one option could be chosen). Forty-one individuals (14%) of the respondents indicated doing none of the several listed wintering practices; these individuals had a 50% winter loss, 12 percentage points higher loss than overall loss of 38%. For those indicating some managements, 66 (27%) did one single thing, 156 did 2, 165 did three (the most common choice), 29 did 4, 20 did 5 and 8 did 6 or 7 (3%); these 8 individuals had 11% loss.
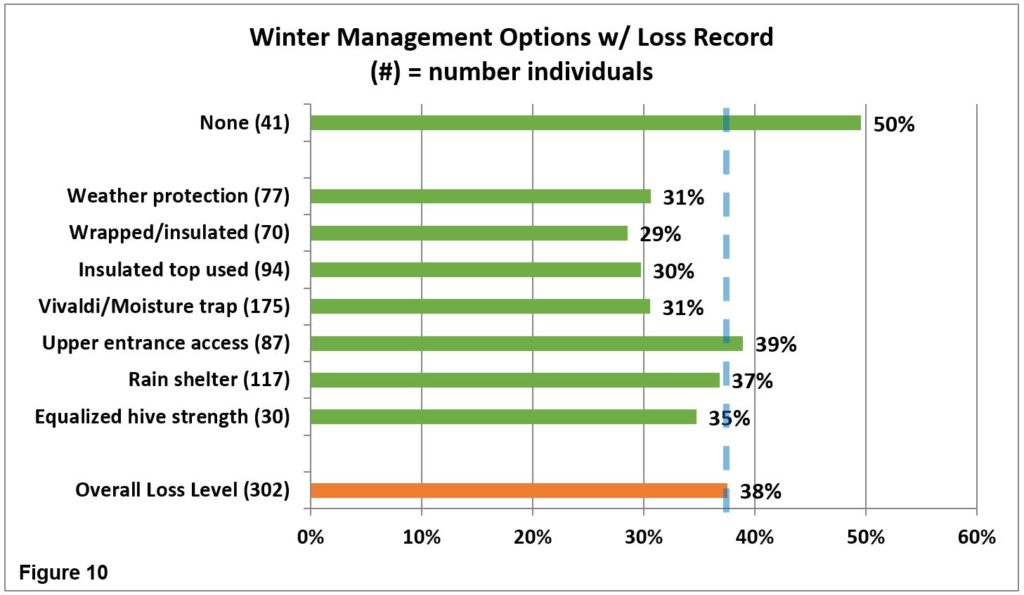
The most common wintering management selected was ventilation/use of a quilt box at colony top (175 individuals (67%), 9 percent higher number of individuals compared to previous year) followed by rain shelter (117 individuals, 45%). Figure 10 shows per cent of individual choices and bar length shows percent winter loss of each selection. Bars to left of green dashed line means better survival than overall. Wrapping Vivaldi/quilt box and wind/weather break both improved survival.
Over the past three years individuals that did no winterizing practice (average 13 1/3% of individuals) averaged 48% loss compared to 41% overall average loss of last 3 years, a 7 percentage point poorer survival rate. Only 2 winterizing managements improved survival all 3 years – these were wrapping (30% lost rate, an 11 percentage point improvement) and upper insulation (32%, a 9 percentage point improvement). Vivaldi (38%), upper entrance, also 38% (most Vivaldi boards have an upper entrance built into the equipment) and wind/weather protection (also 38%) had only slightly improved survival rates – 3 percentage points.
SANITATION PRACTICES: It is critical that we practice some basic bee sanitation (some prefer use of term bee biosecurity) in our bee care to help insure healthy bees. We received 556 responses for this survey question 2.2/individual. Fourteen individuals said they did not practice any of the 6 offered alternatives; they had a loss rate of 52% compared to overall rate of 38%. Over past three years those indicating doing none had a 46% percent loss rate, a mere 5 percentage points higher than the average loss rate of 41% over the same time period. Eighty two (27 %) individuals had 1 selection, 88 (29%) had 2 choices (the greatest number), 62 selected 3 managements, 14 had 4 and 11 had 5 or 6 choices.
Minimal hive intervention (145 individuals) was the most common option selected, as it has been for the last 3 years.It could be argued that less intervention might mean reduced opportunity to compromise bee sanitation efforts of the bees themselves and that excessive inspections/ manipulations can potentially interfere with what the bees are doing to stay healthy. This option however did not demonstrate improved winter survival; the loss rate for this group the past 3 years was 54%, even higher loss rate than the group that did nothing.
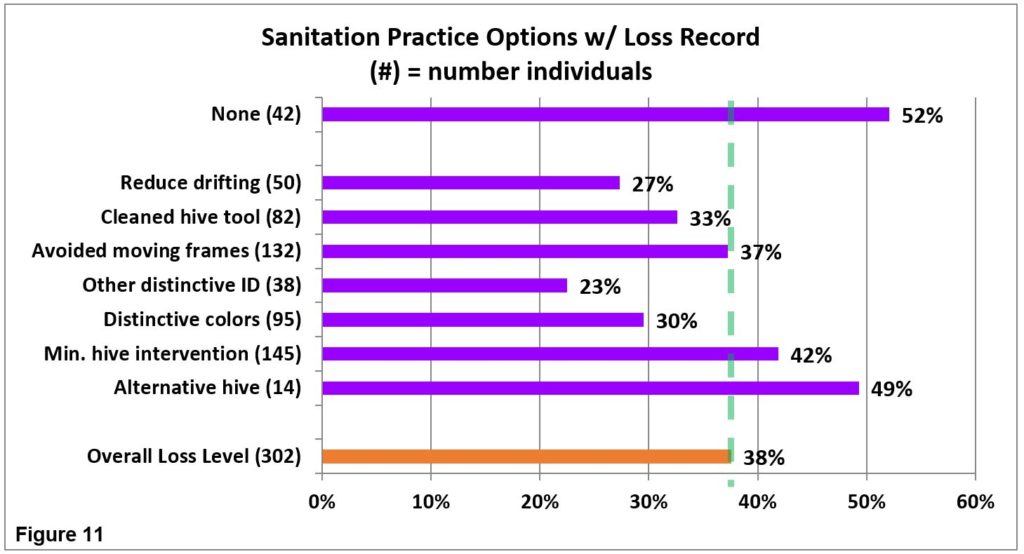
Avoiding moving frames and reducing drifting were the two sanitation choice that demonstrated better average survival the past three years – 4 year loss rate was 35% for not moving frames and 37% for reducing drifting compared to overall rate of 41%, both relatively minor 6 and 3 percentage point differences. Distinctive hive address via painting (40% this year which was also 3 year average) had but a single percentage point advantage over average loss rate (41%) of last 3 years. Sanitation appears to be relatively minor toward improving survival.
SCREEN BOTTOM BOARDS (SBB)
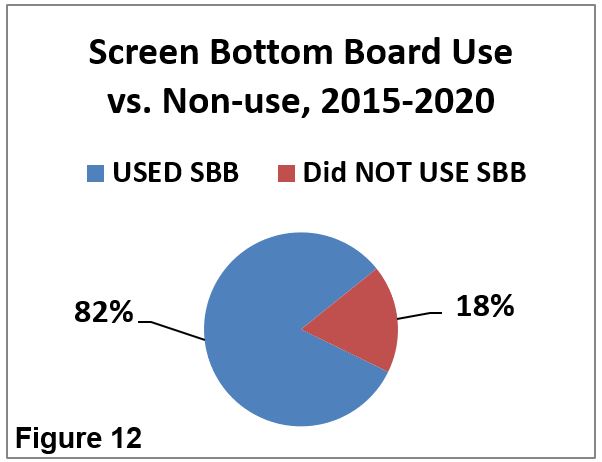
Although many beekeepers use SBB to control varroa, BIP and PNW surveys clearly point out they are not a very effective varroa mite control tool. In this recent survey 30 individuals (10%) said they did not use screen bottom boards. This was the lowest percent of respondent non-use of SBB in last 6 years. Average non-use is 18%, vs 82% use, on some or all colonies over the 6 year period. Figure 12.
This past overwintering season, the 30 non-SBB users (10% of respondents) had 222 fall colonies of which they lost 120 for 54% loss. The 220 beekeepers using SBB on all of their colonies had 37% loss. This was the greatest loss level difference between non-users and users in past 5 years. Examining the five year average of SBB use, loss level of the 82% using SBB on all or some of their colonies had a 41% loss level whereas the 18% not using SBB had loss rate of 36% (a 5 percentage point positive survival gain for those using SBB versus those not using them. Screen bottom boards offer a very minor improvement for overwinter survival.
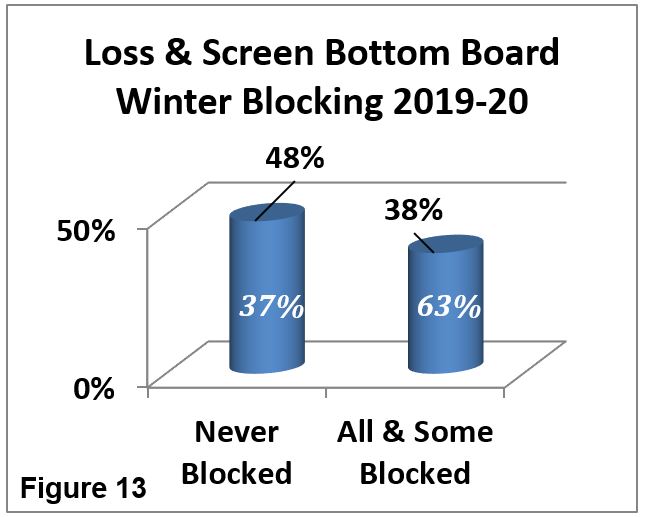
We asked if the SBB was left open (always response) or blocked during winter. This past season 48%, 136 individuals, said they always blocked SBB during winter; 44 individuals statewide said they blocked some of the SBBs. Statewide those who blocked always or sometimes had 1164 colonies in the fall and lost 417, a 36% loss rate. Figure 13 shows that those who never blocked (104 individuals 37%) had a 48% winter loss, a 12 percentage point difference. Comparing the always and sometimes left open with the closed in winter (all closed + some closed) response reveals a 12 percentage point difference in favor of closing the SBB over the winter period to improve survival.
Summary: Screen bottom board use has a slight survival advantage. For those using SBB, the advantage appears to be to close, partially or completely the screen over the winter period.
Things that seem to improve winter success: It should be emphasized that these comparisons are correlations not causation. They are single comparisons of one item with loss numbers. Individual beekeepers do not do only one management nor do they necessarily do the same thing to all the colonies in their care. We do know moisture kills bees, not cold, so we recommend hives be located in the sun out of the wind. If colonies are in an exposed site, providing some extra wind/weather protection and wrapping/insulating colonies might improve survival.
Feeding, a common management appears to be of some help statewide in reducing losses. Feeding fondant sugar, a hard sugar candy or dry sugar during the winter means lower loss levels. Providing frames of honey and feeding sugar syrup also yields lower loses for some individuals. Such feeding management is of great value for spring development and/or development of new/weaker colonies as well as for colony rearing of bees to overwinter. Feeding protein in form of dry pollen and pollen patties did slightly improve survival. The supplemental feeding of protein (pollen patties), might be of assistance earlier in the season to build strong colonies and in the fall to build the fat bee population needed for successful overwintering. To determine if feeding might help monitor what sources your bees are visiting and manage accordingly.
Winterizing measures that apparently helped lower losses for some statewide beekeepers were a moisture trap (Vivaldi board or quilt box) and upper insulation and wrapping the colonies (or otherwise adding some insulation to provide added protection against the elements). Spreading colonies out in the apiary and doing other measures to reduce drifting also appeared to be of some value in reducing winter losses. Avoiding movement of frames from one colony to another might also improve survival but the gain over what this interchange might accomplish to bolster weak colonies and start new divides might be greater than a minor advantage in survival.
It is clear that doing no feeding, winterizing or sanitation resulted in the heaviest overwinter losses.
Replacing standard bottom boards for screened bottoms marginally improved winter survival. It is apparently advantageous to close the bottom screens during winter.
Mite monitoring/sampling and control management
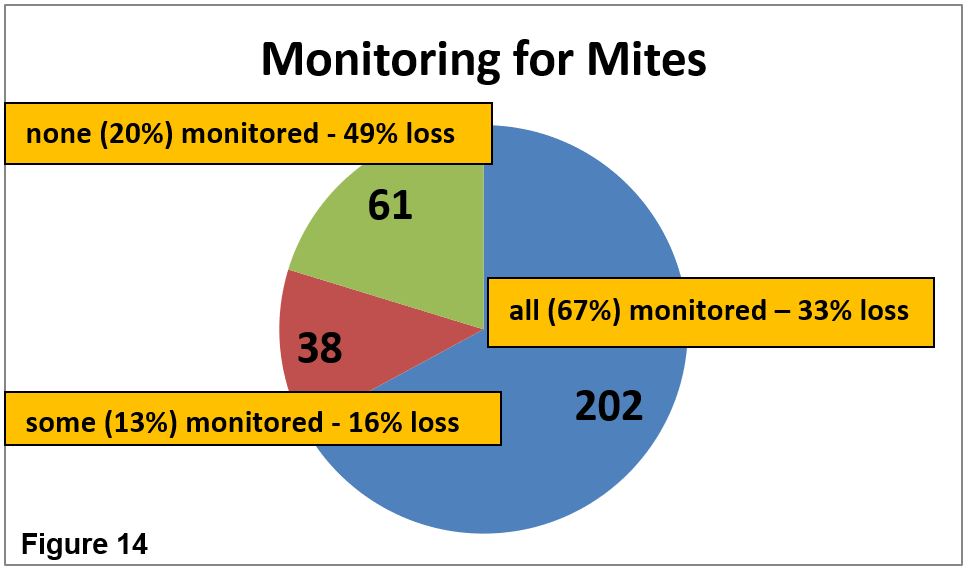
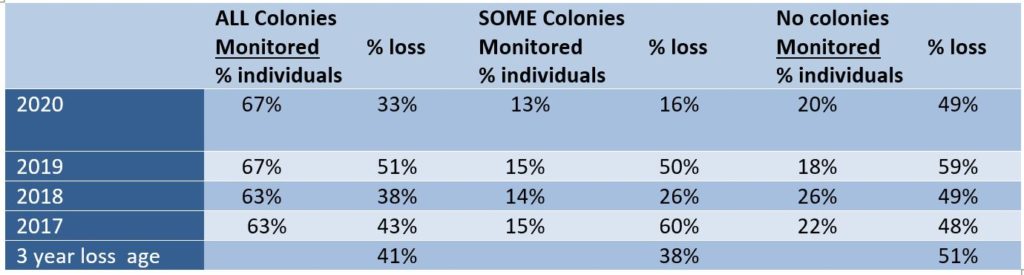
We asked percentage of Oregon hives monitored for mites during the 2019 year and/or overwinter 2019-20, whether sampling was pre- or post-treatment or both and, of the 5 possible mite sampling methods, what method was used and when it was employed. 202 individual respondents (67%), same percentage as previous year, said they monitored all their hives. Losses of those individuals monitoring was 33%. Sixty one (20%), 2 percentage points higher than last year, reported no monitoring; they had a higher loss rate of 49% loss. 38 individuals reported monitoring some of their colonies; they had a 16% loss. See Figure 14.
It is obvious that monitoring alone is a means towards improved winter survival. The table below compares % individuals and % winter loss for individuals who monitored all colonies compared with those who monitored none. Difference is 10 percentage point better survival monitoring all colonies. The 13-15% who monitored some colonies was variable, high two years and lowest two other years (for unknown reasons) but 4 year average mirrors those who monitored all colonies.
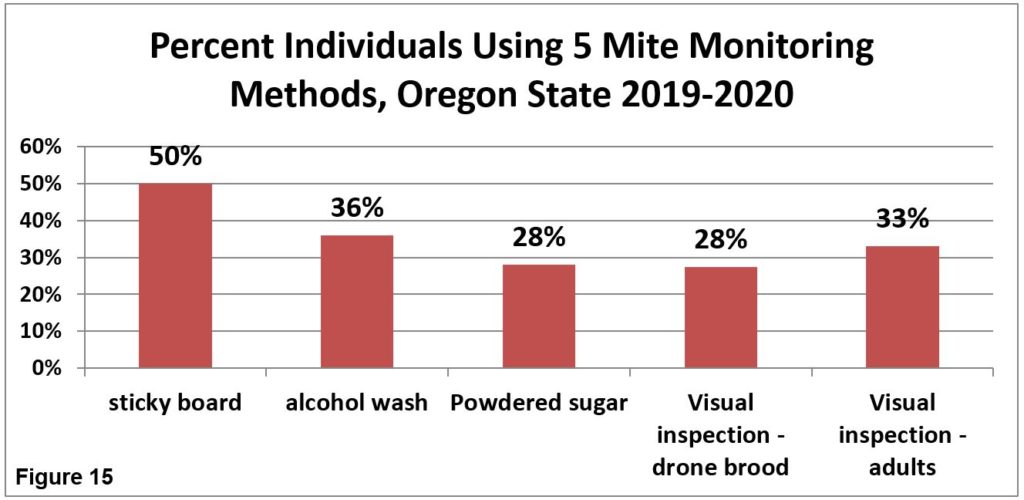
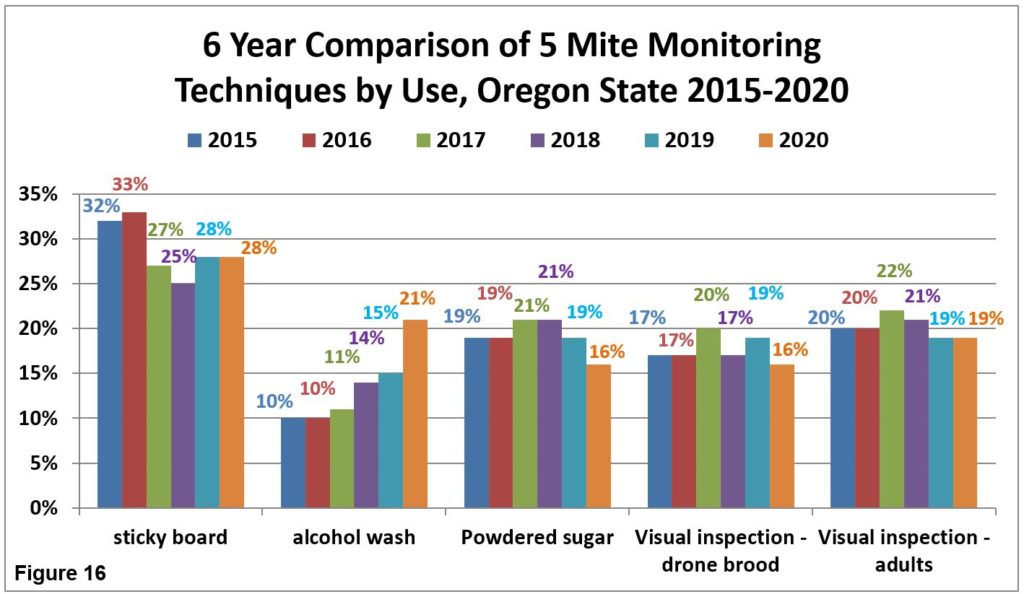
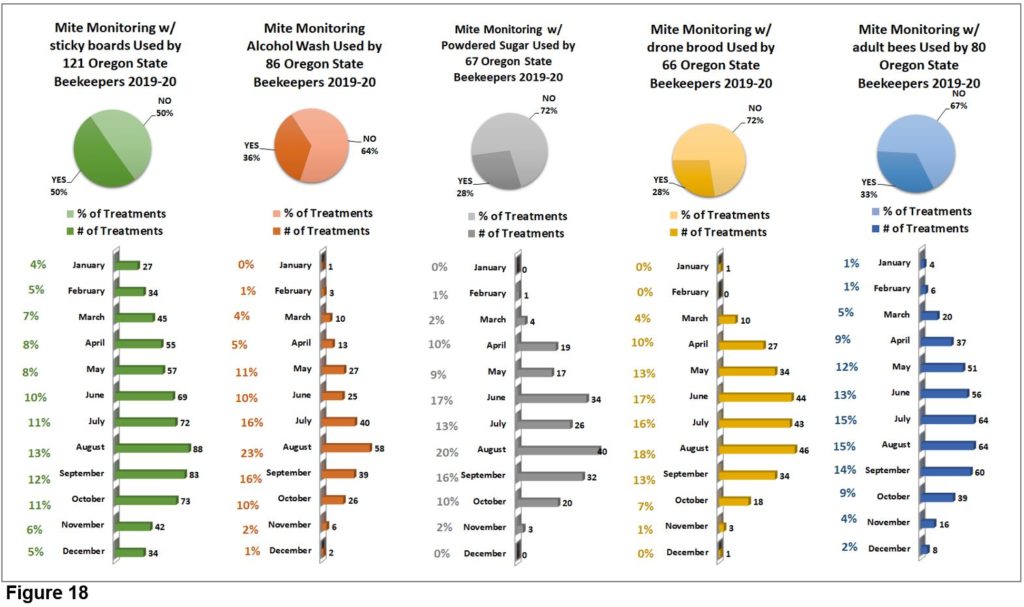
Individuals indicated use of 2 monitoring techniques on average. In total choices In order of popularity of use, Sticky boards were used by 121 individuals, 50% total of 240 individuals who did some or all monitoring of colonies and 72.5% of total number of individuals who monitored, followed by 86 individuals who used alcohol wash to monitor (36% of total number of individuals who monitored), 67 individuals (28% of individuals) used powdered sugar monitoring; visual inspection of drones (66 individuals) and visual inspection of adults (80 individuals) were also indicated (Figure 15). In past 5 years, the use of sticky boards has decreased in use and both alcohol wash and powdered sugar shake have increased in use. Figure 16.
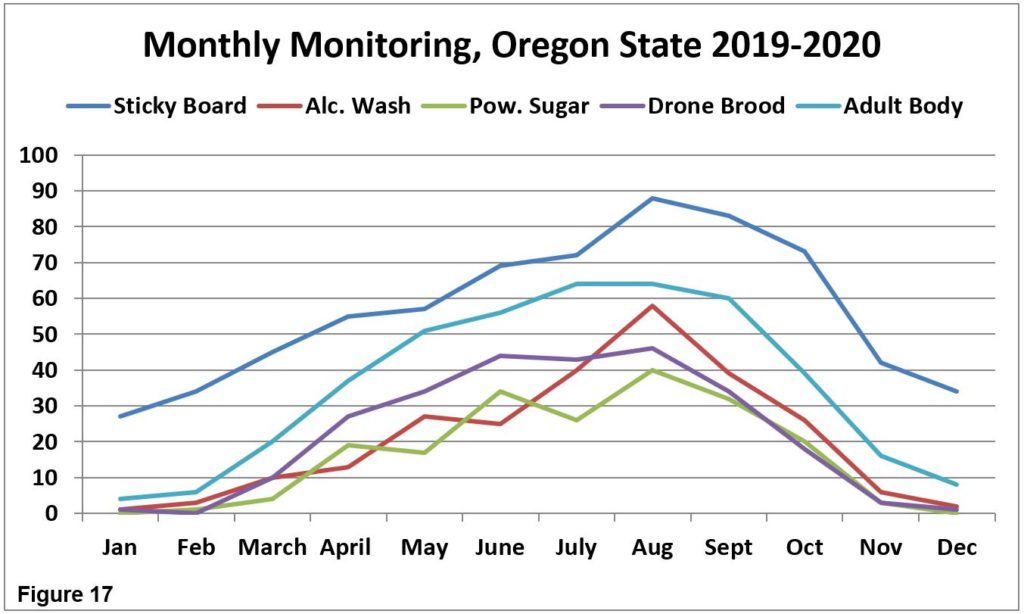
Whatever technique used most sampling to monitor mites was done in July – September, as might be expected since mite numbers change most quickly during these months and sampling results key control decisions. Figure 17 & 18 below illustrate monthly sampling five methods.
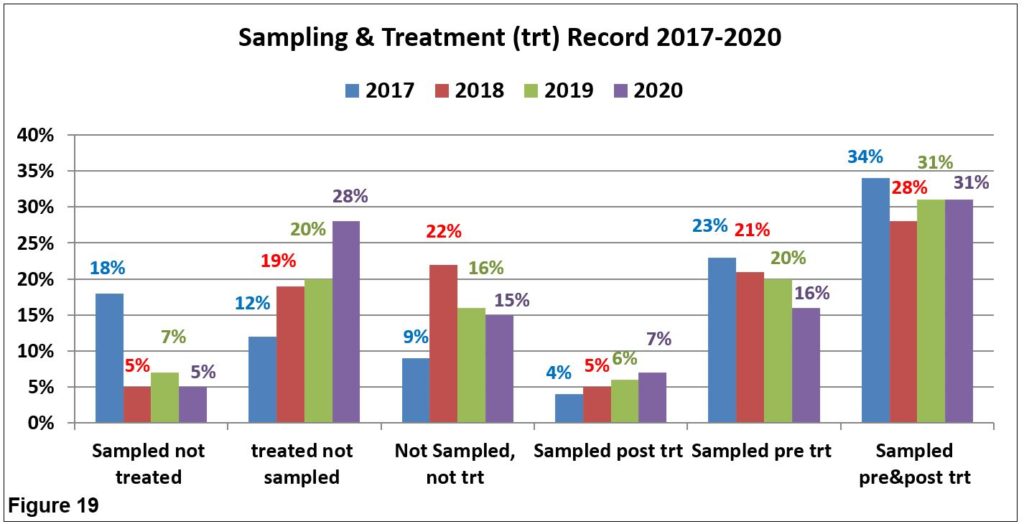
The most common sampling of respondents is both pre and post-treatment (31% average last 4 years). Sampling pre-treatment percentage has been decreasing while post treatment sampling has slowly been increasing. It is important to know if the treatment works so post treatment should not be avoided. Treatment without sampling has been steadily increasing (28% this past year, more than double 4 years previous. Sampling data for last four years in Figure 19.
It is important to KNOW mite numbers. Less effective mite monitoring methods include sticky (detritus) boards below the colony (often so much detritus drops onto a sticky board that picking out the mites can be hard, especially for new beekeepers) but sticky boards used for a single day pre and post treatment can help confirm the effectiveness of a treatment if numbers drop post treatment. Visual sampling is not accurate: most mites are not on the adult bees, but in the brood, especially when there is a lot of brood and the adult mites are NOT on the adult body where they can be observed (over 90% are on the lower abdomen, tucked within the overlapping bee sternites). Sampling for mites on drone brood is also not effective as a predictive number but can be used as an early warning that mites are present; if done, look at what percentage of drone cells had mites. We are not certain why such sampling is indicated for August to December months (see Figure 17 & 18) – there simply is little drone brood to sample during these months.
See Tools for Varroa Monitoring Guide www.honeybeehealthcoalition.org/varroa on the Honey Bee Health Coalition website for a description of and to view videos demonstrating how best to do sugar shake or alcohol wash sampling. The Tools guide also includes suggested mite level to use to base control decisions based on the adult bee sampling. A colony is holding its own against mites if the mite sample is below 2%. It is critical to not allow mite levels to exceed 2-3% during the fall months when bees are rearing the fat fall bees that will overwinter. It is also the most difficult time to select a control method (if one is deemed needed) as potential treatment harm may negatively impact the colony. We are seeing more colonies suddenly disappear (abscond?) during the fall, which may be related to the treatment itself.
Mite Control Treatments
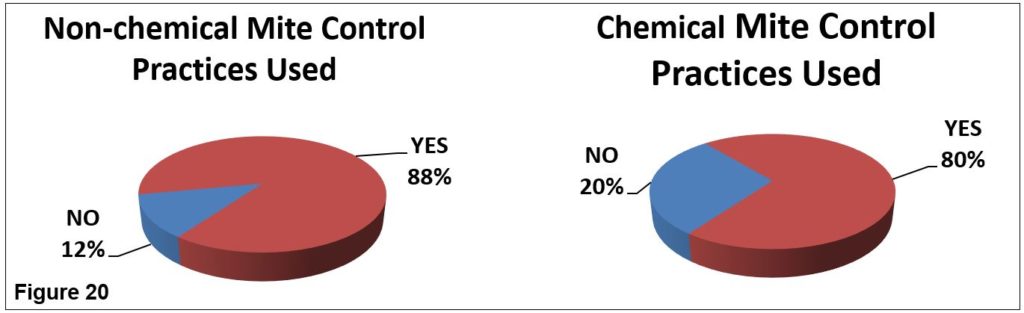
The survey asked about non-chemical mite treatments and also about use of chemicals for mite control. Thirty six individuals (12%), same percentage as last year, said they did not employ a non-chemical mite control and 60 individuals (20%), 4 percentage points fewer, did not use a chemical control. See Figure 20. Those 36 individuals who did not use a non-chemical treatment reported a 61% winter loss, while those who did not use a chemical control lost 57% of their colonies. The individual options chosen for non-chemical and chemical control are discussed below.
Non-Chemical Mite Control: Of nine non-chemical alternatives offered on the survey (+ other
category,) 62 individuals (23%) used one method, 87 (32%) used two, 69 used three, 26 used 4, 20 used 5 and 1 individual used 6. Individuals using a single method had 70% loss rate and the 21 individuals using 5 or 6 had an 18% loss rate; those using 4 had a 34% loss rate. Use of screened bottom board was listed by 231 individuals (87%), about 40 individuals short of number that listed use of SBB in different section of survey (Figure 12). The next most common selection was minimal hive inspection (117 individuals). The use of the remaining selections are shown in Figure 21; number of individuals in ( ), bar length represents average loss level of those individuals using each method. Those left of green dashed line means better survival.
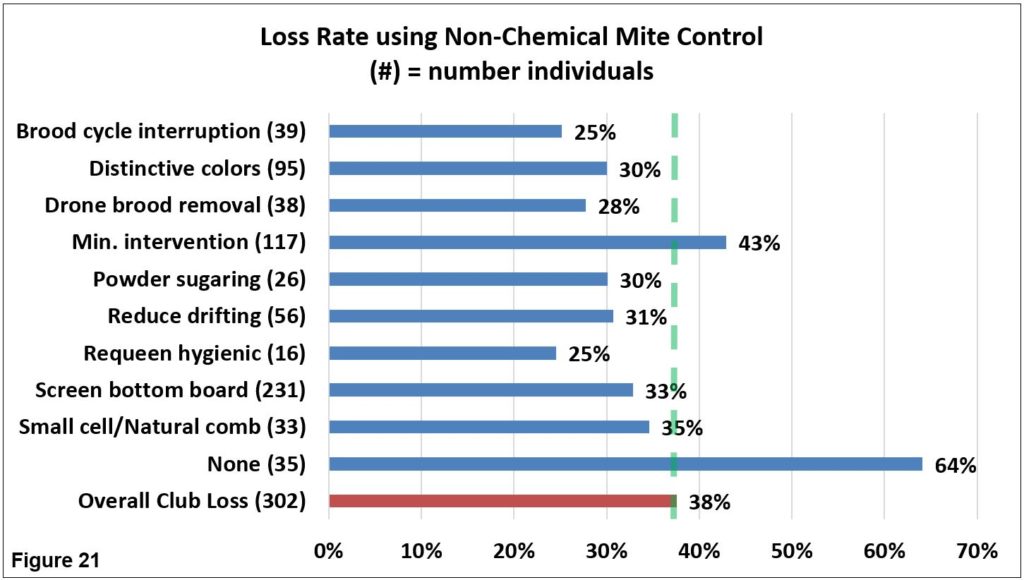
Three of the non-chemical alternatives have demonstrated reduced losses over past 4 years. Reducing drifting such as spreading colonies (35% loss average for 3 years – question not asked in 2016-17 survey), brood cycle break (39% average over 4 years only 4 percentage point better survival and different colony colors in apiary (42% average loss last four years –only one percentage point difference) has demonstrated better survival. Drone brood removal average loss for 4 year is the same as average loss for the four years (43%). Some non-chemical control alternatives demonstrate an advantage on one or two years but overall no improvement.
Chemical Control: For mite chemical control, 60 individuals (20% of total respondents) used NO chemical treatment. They had a loss level of 57%. Those using chemicals used at rate of 1.8/individual. One hundred one individuals (42%) used one chemical (had 40% loss level), 81 used two, 48 used 3, 9 used 4 and three used 5. One hundred twenty OR Beekeepers (50% of total individuals using a chemical) indicated they most commonly utilized MAQS, formic acid. At least 7 said they made their own formulation to apply via shop towels (54% loss), plus an additional 13 used Formic Pro (with the best survival – loss rate of 20%). Oxalic acid vaporization (99 individuals) was twice as commonly used as Oxalic acid drizzle (50 individuals) with the vaporization having 1/3rd better survival. Figure 22 illustrates number of uses ( ) and bar length indicates the loss rate for those using that chemical.
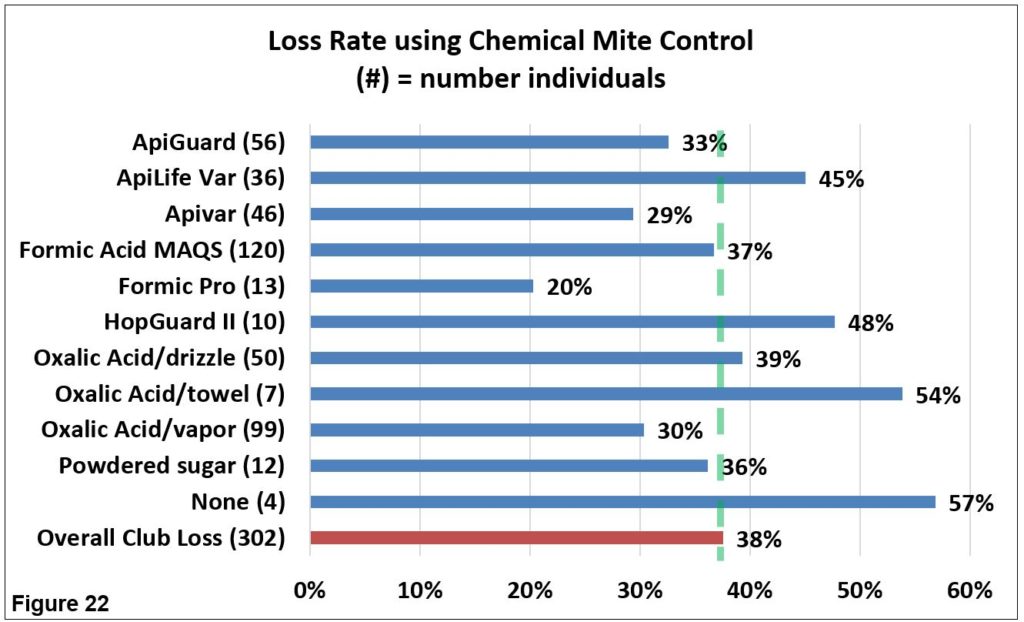
Consistently the last 4 years five different chemicals have helped beekeepers improve survival. The essential oils Apiguard (average 4 year loss level 32%), Apivar (32.5% average 4 year loss level), Oxalic acid vaporization (33.5% average loss level over last 4 years – in contrast the oxalic acid drizzle average of last 3 years is 41% loss level) and ApiLifeVar (36% average loss level over last four years). The formic acid MAGS formulation has same as average loss level (43%).Those who mix formic into shop towels have heavier losses. Formic Pro has increased in use – it looks very promising at a 26% loss level the past two years (when average loss was 43%).
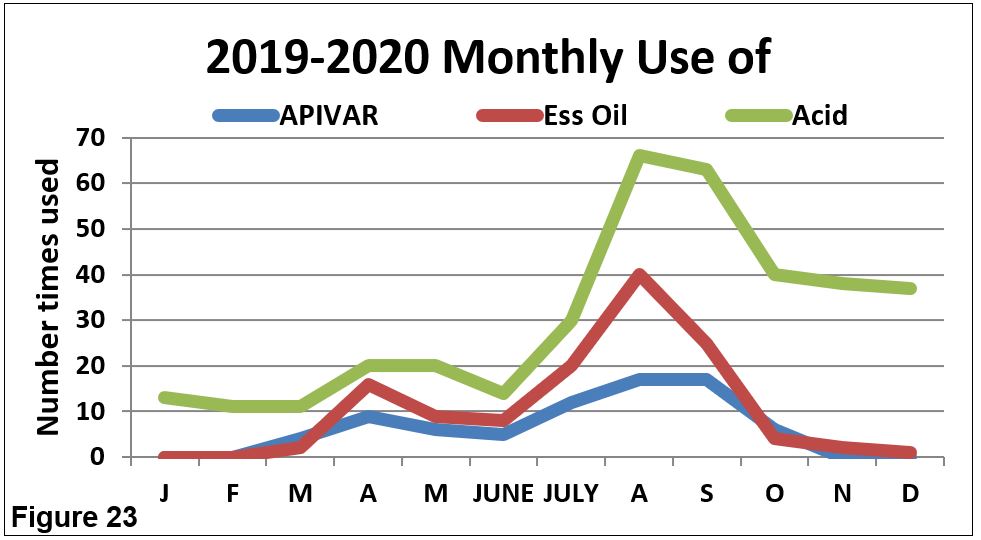
The monthly use of Apivar (blue line), essential oil (red line) or an acid (green line) is shown in Figure 23 for 2019-20 season. Further review is needed to determine if the timing of treatments was more effective than at other times for the various chemicals.
Antibiotic use
Three individuals (1%) used Fumigillan (for Nosema control) and 1 indicated use of nosevet; their loss rate was 50%. Three individuals indicated use of terramycin; they had a 66% loss.
Queens
We hear lots of issues related to queen “problems”. Recall under the question asking the reasons why colonies didn’t survive that 60 individuals, 16% believed queen failure as one of their selections (Figure 8). In Section 8 of the survey we asked what percentage of loss could be attributed to queen problems. Ninety six individuals (32% – double the percentage who indicated queen problems in earlier survey question – I have no idea why the difference) subdivided queen related issues from 10 to 100% of their hives. Figure 24 shows that one hundred and thirty-seven said none (47%); an additional 56 individuals (19%) said they didn’t know.
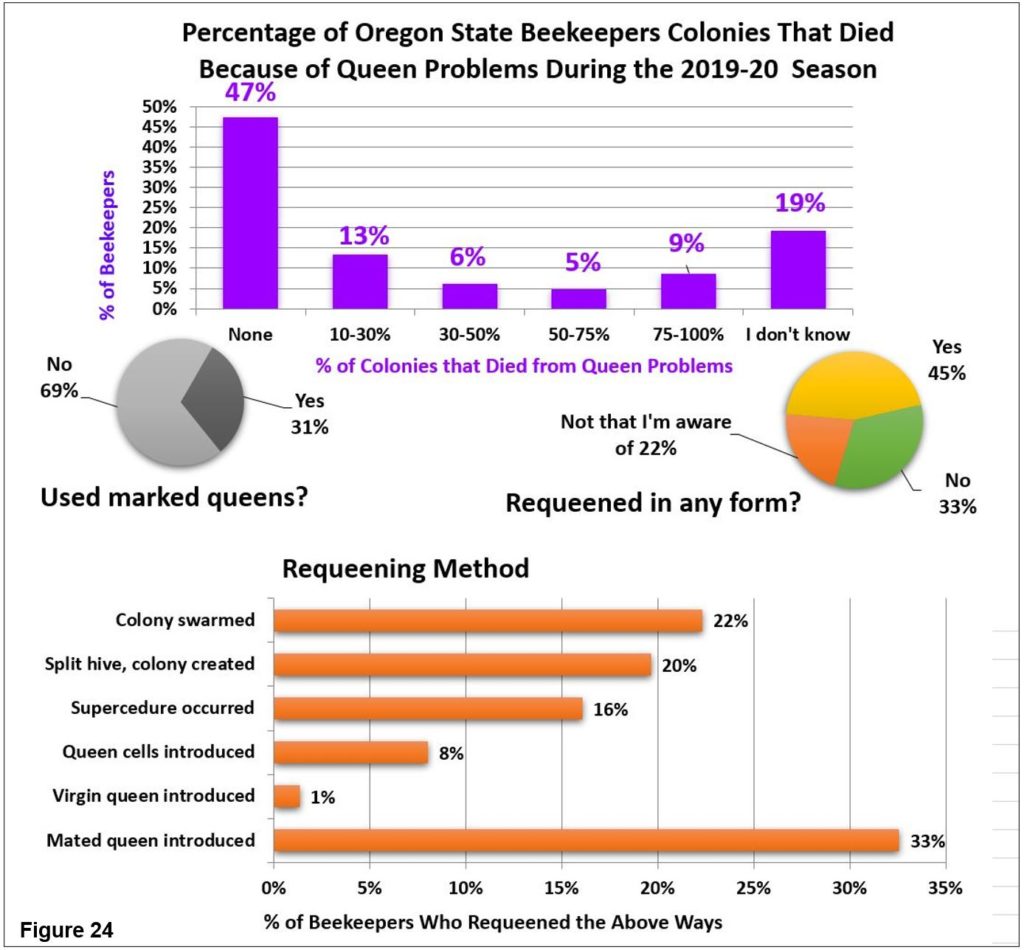
Queen events can be a significant factor contributing to a colony not performing as expected. We asked if you had marked queens in your hives. Ninety two individuals (31%), an increase of 3 percentage points from last year, said yes. The related question then was ‘were your hives requeened in any form?’ to which 45% (135 individuals) said yes, 33% said no and the remainder ‘not that that I am aware of.’ May we then pose the obvious question … If 2/3rds of the beekeepers are not marking their queens then how can they be sure their loss was due to queen problems?
One technique to reduce mite buildup in a colony is to requeen/break the brood cycle. The question “How did bees/you requeen“ received 224 responses One-third of respondents indicated their bees were requeened with a mated queen, nearly a quarter indicated it was the bees that requeened via swarming (22%), supersedure (16%) or emergency rearing (20%). That means too few were seeking to use this valuable tool for mite control. Figure 21 illustrates the non-chemical mite control of brood break (25% loss) or use of hygienic queens (25% loss level) reinforces that this manipulation is not heavily utilized.
Closing comments
This survey is designed to ‘ground truth’ the larger, national Bee Informed loss survey. Some similar information is additionally available on the BeeInformed website www.beeinformed.org and individuals are encouraged to examine that data base as well. Recall that the BeeInformed survey is measuring the larger scale OR beekeepers not the backyarders (See American Bee Journal April 2020 article). Reports for individual bee groups are customized and posted to the PNW website.
We intend to continue to refine this instrument each season and hope you will join in response next April. We have a blog on the pnwhoneybeesurvey.com and will respond to any questions or concerns you might have.
Thank You to all who participated. If you find any of this information of value please consider adding your voice to the survey in a subsequent season.
Dewey Caron and Jenai Fitzpatrick, June 2020
Winter Bee Losses of Washington Backyard Beekeepers for 2019-2020
by Dewey M. Caron and Jenai Fitzpatrick
Overwintering losses of small-scale Washington backyard beekeepers decreased this past winter, dipping one percentage point below the 5-year loss average. One hundred thirty-three Washington beekeepers (35 more than last year) supplied information on winter losses and several managements related to bee health with an electronic honey bee survey instrument www.pnwhoneybeesurvey.com.
Response by local Oregon (OR) & Washington (WA) association varied as indicated by blue bars in Figure 1. Statewide loss level is highlighted with Orange bar. The number of respondent individuals is listed next to the association name. The bar length is the average club loss percentage for the year. Total fall colony response was 302 OR and 133 WA individuals; survey included 780 fall Washington beekeeper colonies. Total WA backyard beekeeper overwinter loss = 50% loss.
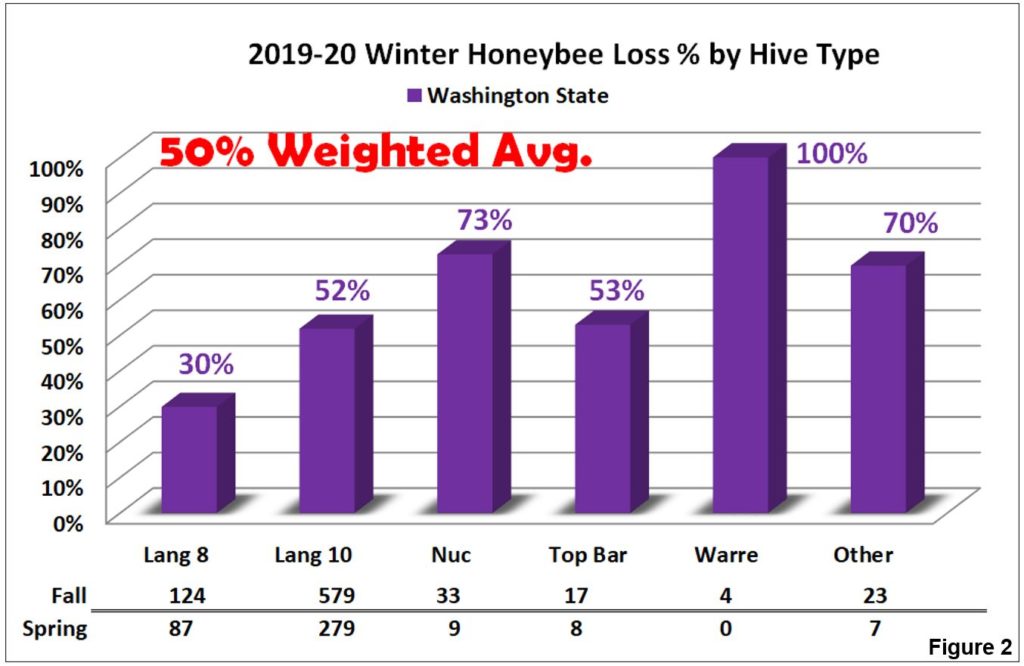
2019-2020 Overwinter Losses by Hive Type
The Washington survey overwintering loss statistic was developed by subtracting number of spring surviving colonies from fall colony number supplied by respondents by hive type. Results, shown in Figure 2 bar graph, illustrate overwintering losses of 133 total WA beekeeper respondents. Langstroth 8 and 10 frame beehives (90% of total) had lower average losses (48%) than the 21 Top Bar and Warré hives (62%). In the category other, there were 4 AZ hives and 4 horizontal hives; remainder were not identified.
The WA respondents to the electronic survey managed up to 45 fall colonies. Twenty individuals had 1 colony, 33 respondents had 2 colonies (the greatest number) and 19 individuals had 3 colonies (72 individuals, 54% of total respondents had 1, 2 or 3 colonies), 30 individuals had 4 to 6 colonies, 11 had 7-9 colonies, 12 individuals had 10-19 colonies and 7 individuals had 20+ colonies. When loss levels were compared, the 1-3 colony owners had a 50% loss; the 10+ individuals had 47% loss of colonies in 2019-20 overwintering period.
Fifty nine individuals (44% of respondents) had 1, 2 or 3 years of experience; 39 individuals (29% of total respondents) had 4 – 6 years’ experience (medium number = 4), 12 individuals had 7-9 years experience and 23 had 10+ years with 61 the greatest. When loss level was correlated to experience, the 59 individuals with 1-3 years experience had 55% loss level and the 10+ years experience group (23 respondents) had a 47% loss.
Ninety six (76%) of WA beekeepers had an experienced beekeeper mentor available as they were learning beekeeping. This percentage was up from 73% the previous year.
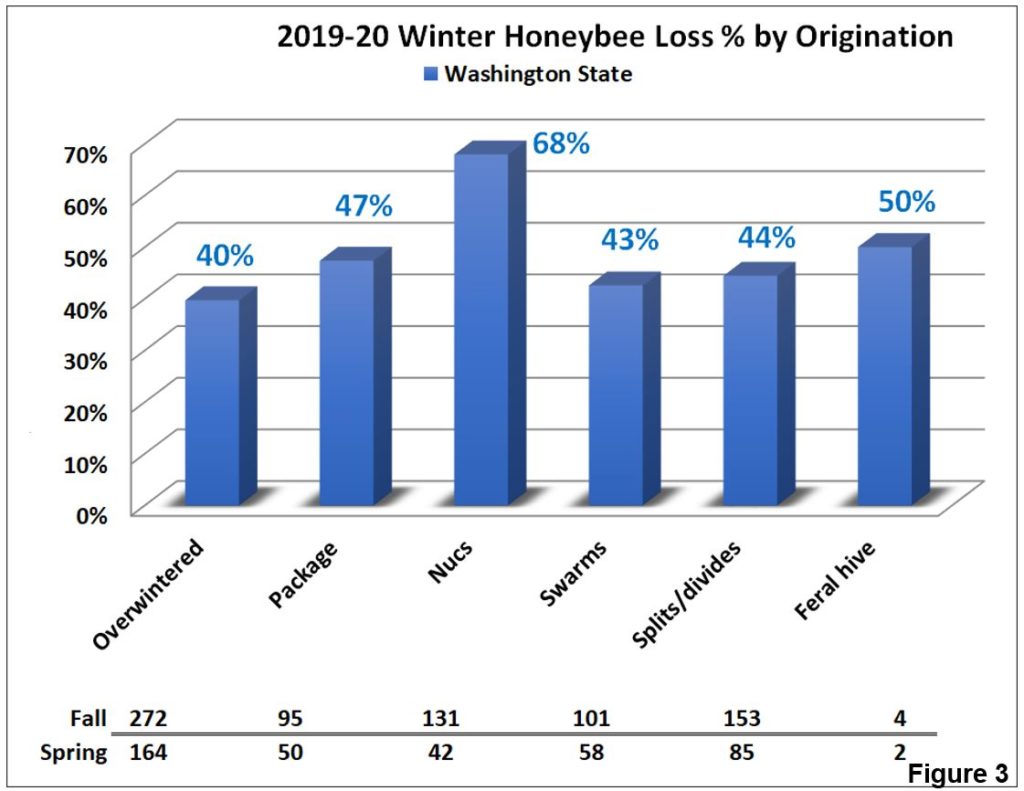
Survival Based on Hive Origination
We also asked about hive loss by origination. Data shown in Figure 3. All but nucs had similar loss level; overwintered hives exhibited slightly greater survival. The 303 Oregon beekeepers had the same situation with losses overwinter from nuc origination being more likely than the remaining originations (see OR statewide report).
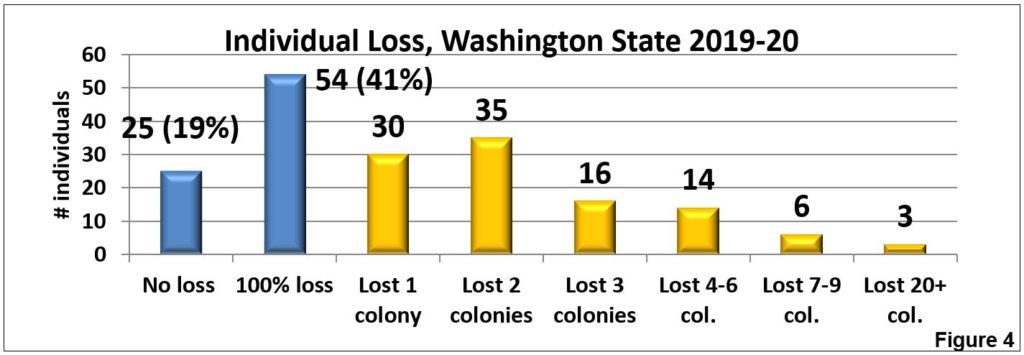
Among 133 WA beekeepers 19 individuals (14%) maintained more than one hive type. For the total WA beekeeper respondents, 25 (19%) had no loss and 54 individuals (41%) had total loss. Thirty WA individuals lost 1 colony, 35 individuals lost 2 colonies and 16 individuals lost 3 colonies (75% of individuals with losses). Nine individuals lost 10 or more colonies; highest loss was 30 colonies. Data in Figure 4. Twenty individuals (15%) had 10 or more colonies. They lost 47% of their colonies compared to 50% overall loss for Washington beekeepers.
Comparison to Larger-Scale Beekeeper Losses
A different (paper) survey instrument was mailed to Pacific Northwest (PNW) semi-commercial (50-500 colonies) and commercial beekeepers (500+) asking about their overwintering losses. Comparison is shown in Figure 5 below with approximate number of colonies represented by the commercial/semi-commercial beekeepers and number of individual backyarder survey respondents. Also shown is the trend line of losses of both groups. Average loss level for Washington backyarders=51% and for Washington commercial/semi-commercial beekeepers = 33%.
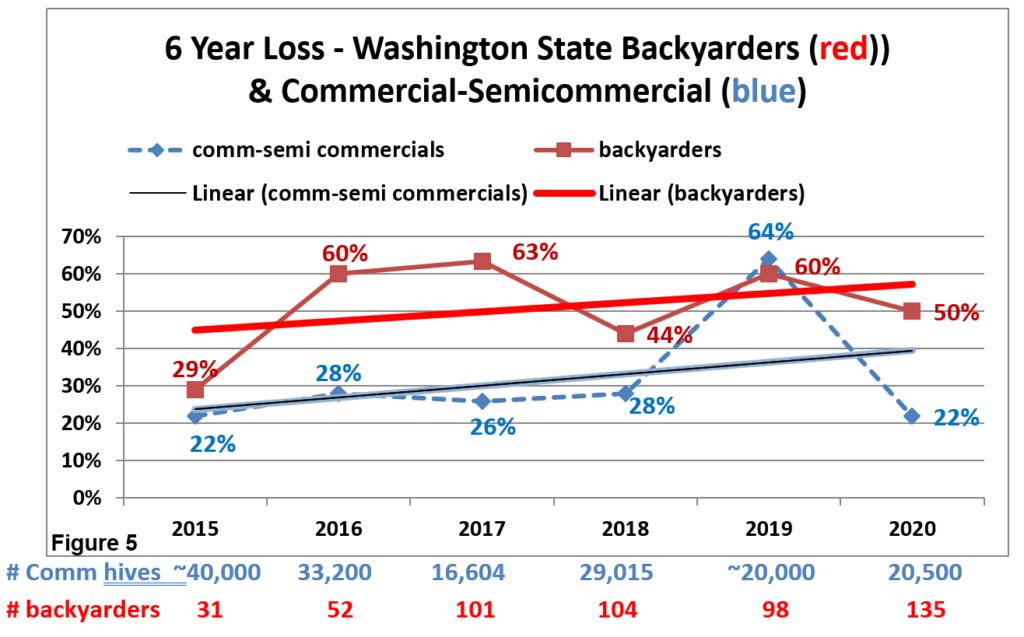
Backyard losses have consistently been higher, in some years double the losses of larger-scale beekeepers but in 2018-19 the commercial losses were higher than backyarder losses. Number of colonies of the commercial keepers returning surveys were essentially the same this past season (returns were an estimated 26% of the NASS estimate of 77,000 colonies in the state). The reasons backyarders have had higher losses 4 of the past 5 years are complex. Commercial and semi-commercial beekeepers examine colonies more frequently and they examine them first thing in the spring as they take virtually all of their colonies to pollinate almonds in February. They also are more likely to take losses in the fall and are more pro-active in varroa mite control management.
The PNW survey was conducted in part to “ground truth” the annual BeeInformed Survey (BIP) also conducted during April. The BIP survey includes a mailed survey to larger-scale beekeepers and an electronic survey to which any Washington beekeeper can submit their data. Losses reported include colonies of migratory beekeepers who reported WA as one of their yearly locations. The BIP survey for the 2015-19 annual surveys (2020) data not yet available) reports receiving responses from 90 to 95% of respondents exclusive to Washington but loss is computed on no more than 4% of the colonies exclusive to Washington state, indicating the BIP tally is primarily of commercial beekeepers (whom almost exclusively move to CA for pollination of almonds). Average 5-year BIP WA loss is 23.7%. To access this data see https://beeinformed.org/take-survey/
Colony Death Perceived Reason and Acceptable Level
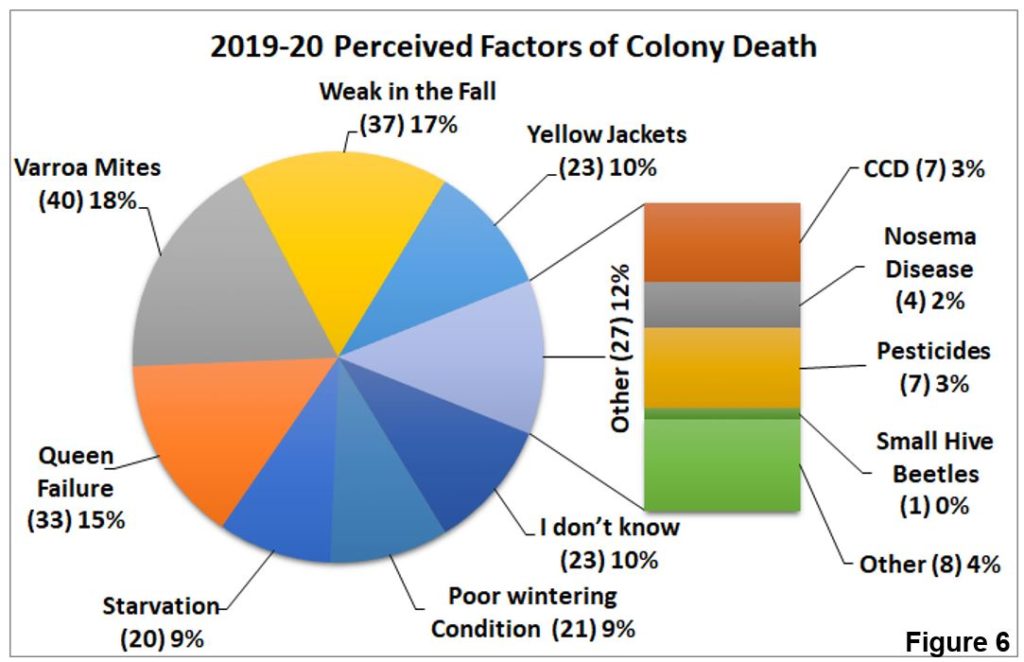
We asked survey takers who had winter losses for the “reason” for their losses. More than one selection could be chosen. In all there were 188 WA selections (1.75/individual) provided. Weak in the fall (37 individual choices), Varroa mites (40) and queen failure (33 selections) were most common choices. Figure 6 shows the number and percent of factor selections.
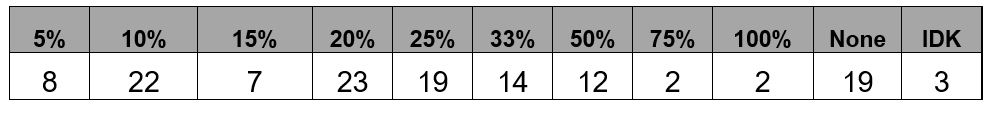
Acceptable loss: Survey respondents were asked reason for loss. Nineteen (14%) indicated zero (no loss). Twenty eight percent of individuals indicated 15% or less. 20% was medium choice. Twelve percent said 50% of greater was an acceptable loss level. See table below.
Why do colonies die? There is no easy way to verify reason(s) for colony loss. Colonies in the same apiary may die for different reasons.There appears to be no single reason for loss and a good deal of variance in opinion as to what might be an acceptable loss level. We are dealing with living animals which are constantly exposed to many different challenges, both in the natural environment and the beekeeper’s apiary. Major factors are thought to be mites, pesticides, declining nutrition adequacy of the environment and diseases, especially viruses and Nosema. Management, failure to do something or doing things incorrectly, remains a factor in our losses. More attention to colony strength and checking stores to help avoid winter starvation will help reduce some of the losses. So there is no simple answer to explain the levels of current losses nor is it possible to demonstrate that they are excessive for all the issues facing honey bees in the current environment.
Colony Managements
We asked in the survey for information about some managements practiced by respondents. The survey inquired about feeding practices, wintering preparations, sanitation measures utilized, screen bottom board usage, mite monitoring, both non-chemical and chemical mite control techniques and queens. Respondents could select multiple options and there was always a none and other selection possible. This analysis seeks to compare responses of this past season to previous survey years.
Most Washington beekeepers do not perform just one management to their colony (ies) toward improving colony health and overwintering success. This analysis however compares a single factor equated with loss level. Such analysis is correlative and doing a similar management as fellow beekeepers does not necessarily mean you too will improve success.
FEEDING: Washington survey respondents checked 348 feeding options = 3.1/individual. Three individuals made no selections – they had 50% loss. Twenty one selected a single choice and had 66% loss level, 35 indicated 2 choices and had a 57% loss, 37 (the greatest choice and also the median) made 3 choices and reported a 49% loss level. Twenty-eight respondents had 4 choices with a 53% loss and 6 individuals had 5 – 7 choices with the lowest loss level 12%.
The choices, with number of individuals making that selection is in ( ), bar length indicates loss level of individuals doing this management. Those bar lengths to left of 54% (green dashed line) had better survival while those to right had greater loss level.
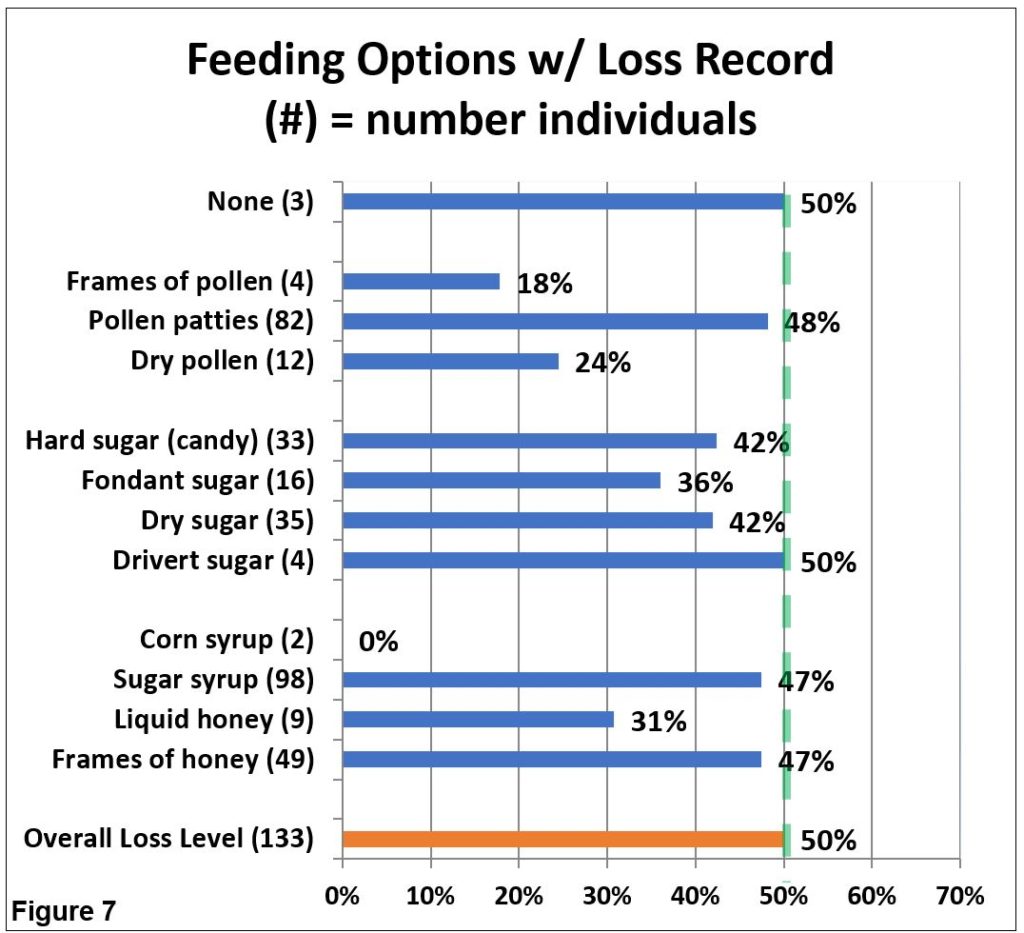
For individuals indicating one or more feeding managements, feeding sugar syrup was the most common feeding option of respondents (98 individuals, 76% of respondents). Their loss rate was 47%, statistically same as overall average. Eighty two individuals fed pollen patties (61%) and had same loss level. The managements that showed best survival included feeding fames of pollen and dry pollen, feeding non-liquid sugar and feeding liquid honey. The two corn syrup feeders had no loss.
For the last 3 years of losses individuals doing no feeding had poorer survival all 3 years; this year they had average loss. Individuals that fed sugar syrup had marginal lower loss level in 3 of four years as did those using frames of honey to feed bees. Individuals feeding non–liquid sugar in the form of fondant and hard candy likewise had lower losses in at least two years, including this most recent survey year; hard candy improved survival in three of the four years. For individuals feeding protein, protein patty users showed slightly better survival in 3 of 4 years; dry pollen feeders had significantly better survival in three of the four years, including this past year when 12 individuals had only a 24% loss, one-half overall loss.
WINTERING PRACTICES: We received 312 responses (2.5/individual) about WA beekeeper wintering management practices (more than one option could be chosen). Eleven individuals (8%) indicated none of the several listed wintering practices was done; these individuals had a 74% winter loss, 24 percentage points higher loss than overall loss of 50%. For those indicating some managements, 27 did one single thing had 50% loss level, 32 respondents doing 2 had 53% loss, 28 had 3 choices with a 41% loss (the medium choice), 21 did 4 (47% loss) and 8 made 5 or 6 choices had lowest loss level of 21%.
The most common wintering management selected was ventilation/use of a quilt box at colony top (72 individuals (51% loss), followed by rain shelter provision (60 individuals 48% loss) and upper entrance bee access (58 individuals, 38% loss). Figure 8 shows number of individual choices and percent of each selection. Bar length below 50% (blue dashed line) had better than average winter survival.
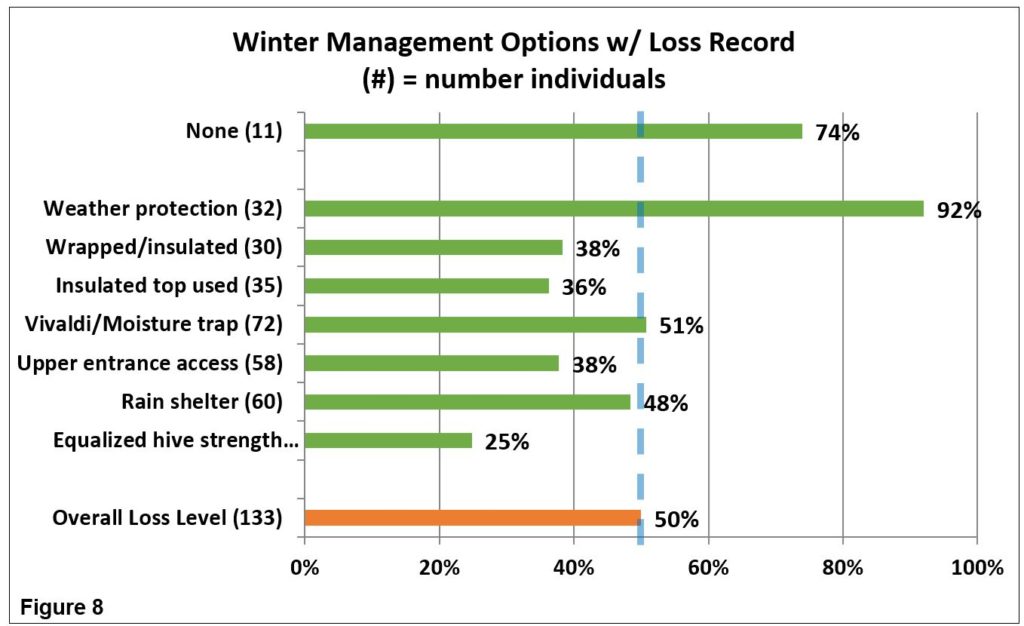
Over the past three years a couple of winterizing management improved survival. Those doing no winterizing had higher losses all 4 years. Equalizing hive strength in the fall demonstrated lower loss levels in all four recent winter periods (only 25% loss this past winter). Top insulation has demonstrated lower loss in three of the four years, in the most recent winter 35 individuals realized a 14 percentage point improvement. Ventilation above the colony (Vivaldi Board/quilt box) demonstrated improved survival two of the four winters but not this past one (1 percentage point higher loss).
SANITATION PRACTICES: It is critical that we practice some basic bee sanitation (some prefer use of term bee biosecurity) in our bee care to help insure healthy bees. We received 158 responses for this survey question 2.2/individual. Seventeen individuals (13%) said they did not practice any of the 6 offered alternatives; they had a loss rate of 44% compared to overall rate of 50%. Forty individuals had 1 selection and had 42% loss, 26 had 2 choices with 50% loss, 34 selected 3 managements with 67% loss; ten had 4 and 5 selection (34% loss).
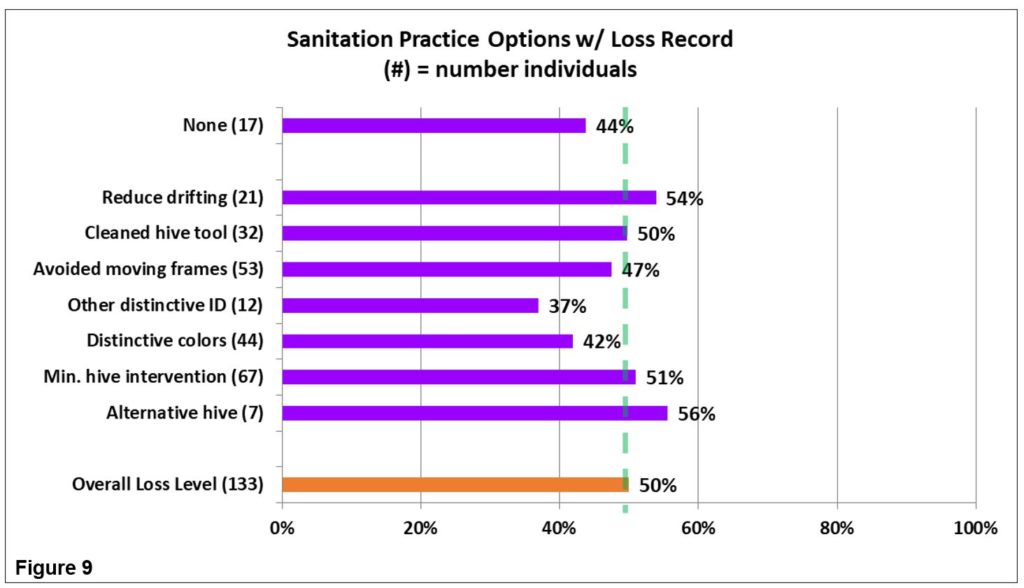
In three of four years doing none of these managements resulted in improved survival; this was the case this past winter when the 17 individuals doing nothing had losses of 44%. Using an alternative hive resulted in lower losses in two of four winters but not this past year. Providing hives with color, distinctive hive ID measures were helpful managements this past winter but not in the previous two seasons, though their loss level was same as or similar to overall loss level (these three choices were not always available in previous survey years).
SCREEN BOTTOM BOARDS (SBB)
Although many beekeepers use SBB to control varroa mites, BIP and PNW surveys clearly point out they are not or at best not a very effective varroa mite control tool. In this recent survey 20 Washington individuals (16%) said they did not use screen bottom boards; they lost 78% of their colonies. Those 80 beekeepers using SBB on all of their colonies had 60% loss. The 24 individuals using SBB on some of their colonies had 34% loss.
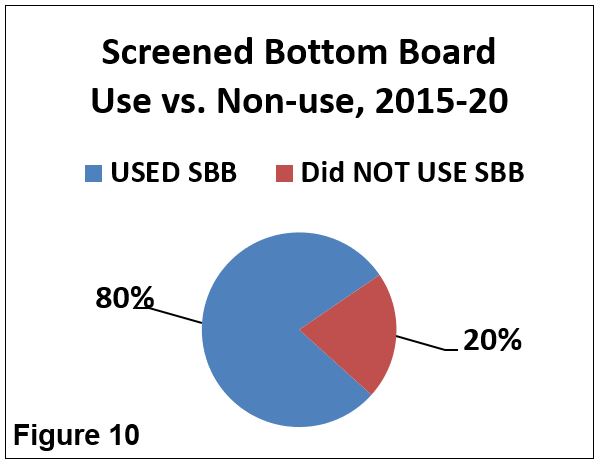
In 5 survey years 20% said they did not use SBB and 80% did use SBB on some or all of their colonies, see Figure 10.
Examining the five year average of SBB use, loss level of those using SBB on all or some of their colonies had a 42.8% loss level whereas for those not using SBB had loss rate of 44.2% (a 3% positive survival gain for those using SBB versus those not using them). They are very minor in improving overwinter survival.
We asked if the SBB was left open (always response) or blocked during winter (bottom Figure 10). This past season 66 individuals (53%) said they always blocked SBB during winter. They had a 44% loss rate, average loss rate for statewide. Thirty six individuals (29%) said they never blocked SBB and had loss rate of 60%. Thirteen individuals (10%) blocked them on some of their colonies. Their loss rate was 79%.
There is no good science on whether open or closed bottoms make a difference overwinter but some beekeepers “feel” bees do better with it closed overwinter. Comparing the always and sometimes left open with the closed in winter response reveals a 16 percentage point difference in favor of closing the SBB over the winter period.. This relationship has been consistent over the past five years averaging nearly a 10 percentage point advantage when the SBB is closed during the winter. An open bottom, at least during the active brood rearing season, can assist the bees in keeping their hive cleaner and promote good hive ventilation.
Things that seem to improve winter success: It should be emphasized that these comparisons are correlations not causation. They are single comparisons of one item with loss numbers. Individual beekeepers do not do only one management option nor do they necessarily do the same thing to all the colonies in their care. We do know moisture kills bees, not cold, so we recommend hives be located in the sun out of the wind. If exposed, providing some extra wind/weather protection might improve survival.
Feeding, a common management appears to be of some help in reducing losses. Feeding fondant sugar or a hard sugar candy during the winter meant lower loss levels. Providing frames of honey or sugar syrup, the most common selection, also meant slightly lower loses for some individuals but these basic managements are useful in other ways such as for spring development and/or development of new/weaker colonies besides insuring better winter survival.
Feeding protein in form of pollen patties did slightly improve survival. The supplemental feeding of protein (pollen patties), might be of assistance earlier in the season to build strong colonies.
Winterizing measures that apparently helped lower losses for some beekeepers was equalizing strength, providing an upper entrance, a moisture trap (Vivaldi board or quilt box) and some attention to adding protection against the elements. Spreading colonies out in the apiary and painting distinctive colors or doing other measures to reduce drifting also appeared to be of some value in reducing winter losses. Avoiding movement of frames from one colony to another might also improve survival but the gain over what this interchange might accomplish might be greater than a minor advantage in survival.
It is clear that doing nothing for feeding or winterizing or this past season in sanitation resulted in the heaviest overwinter losses.
Replacing standard bottom boards for screened bottoms only marginally improved winter survival. It is apparently advantageous to close the bottom screens during winter.
Mite monitoring/sampling and control management
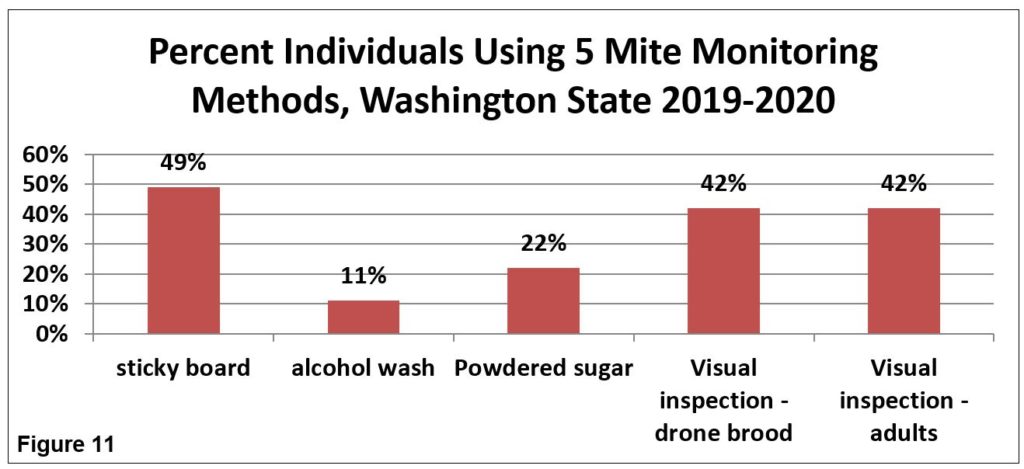
We asked percentage of Washington hives monitored for mites during the 2019 year and/or overwinter 2019-20, whether sampling was pre- or post-treatment or both and, of the 5 possible mite sampling methods, what method was used and when it was employed. Eighty six individual respondents (65%) said they monitored their hives. Losses of those individuals monitoring was 44%. Thirty three (25%), reported no monitoring; they had a higher single percentage point higher loss rate of 45&. Thirteen individuals monitored some with loss rate 70%.
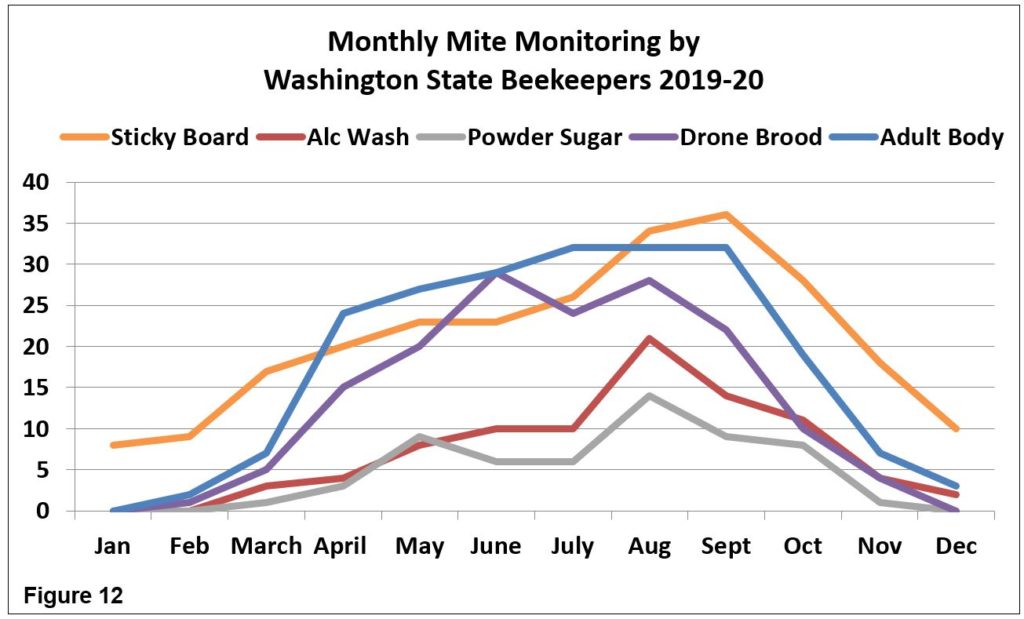
In order of popularity of use, Sticky boards were used by 49 individuals, 49% total of 99 individuals who did some or all monitoring of colonies, followed by 42 individuals (42% of individuals doing monitoring) that used both visual inspection of adults and visual inspection of drones brood. The two most accurate means of determining mite load, alcohol wash was used by 11 individuals (11%) and powdered sugar was employed by 22 respondents (22%). Individuals were able to select more than one option and averaged 1/7/individual. Figure 11.
Most sampling to monitor mites was done in July – September, as might be expected since mite numbers change most quickly during these months and results of sampling can most readily be used for control decisions. See Figure 12 below for number of months each of the 5 sampling methods were used.
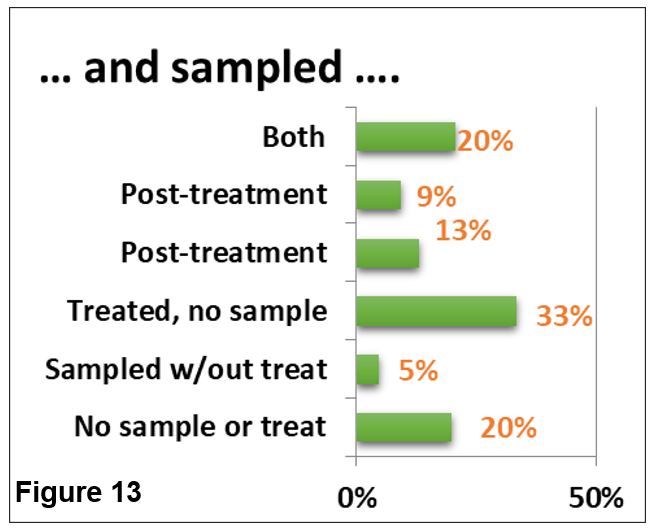
The most common sampling of respondents in 2018-19 was treated but did not sample (33% individuals) followed by both and not sampling nor treating. Thirteen indicated sampling pre and 9% post. Selections shown in Figure 13 to right.
It is important to KNOW mite numbers. Less effective mite monitoring methods include sticky (detritus) boards below the colony (often so much detritus drops onto a sticky board that picking out the mites can be hard, especially for new beekeepers) but sticky boards used for a day can help confirm the useful of a treatment when inserted post treatment. Visual sampling is not accurate: most mites are not on the adult bees, but in the brood. Unfortunately looking for mites on drone brood is also not effective as a predictive number but can be used as an early warning that mites are present; if done, look at what percentage of drone cells had mites.
See Tools for Varroa Monitoring Guide www.honeybeehealthcoalition.org/varroa on the Honey Bee Health Coalition website for a description of and to view videos demonstrating how best to do sugar shake or alcohol wash sampling. The Tools guide also includes suggested mite level to use to base control decisions based on the adult bee sampling. A colony is holding its own against mites if the mite sample is below 2%. It is critical to not allow mite levels to exceed 2% during the fall months when bees are rearing the fat fall bees that will overwinter. It is also the most difficult time to select a control method (if one is deemed needed) as potential treatment harm may negatively impact the colony. We are seeing more colonies suddenly disappear (abscond?) during the fall, which may be related to the treatment itself.
Mite Control Treatments
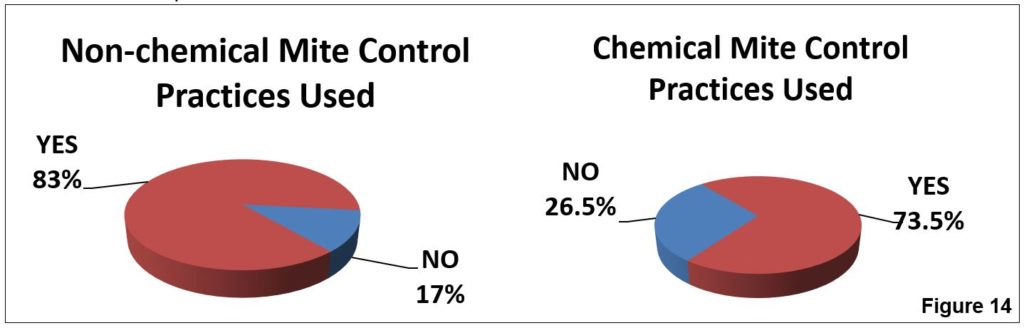
The survey asked about non-chemical mite treatments and also about use of chemicals for mite control. Twenty three individuals (17%), 5 individuals more than last year, said they did not employ a non-chemical mite control and 35 individuals (26½%), fifteen more than last year, did not use a chemical control. See Figure 14. Those 23 individuals who did not use a non-chemical treatment reported a 61% winter loss, while those who did not use a chemical control lost 63% of their colonies. The individual options chosen for non-chemical and chemical control are discussed below.
Non-Chemical Mite Control: Of nine non-chemical alternatives offered on the survey (+ other category,) 39 individuals used one method and had a 39% loss, 28 used two (52% loss level), 37 used three (60% loss) and 12 used 4 or 5 (42% loss). Total selections were 240 2/individual. Use of screened bottom board was listed by 79 individuals. They had average losses. The next most common selection was minimal hive inspection (51 individuals) and they had 12 percentage point higher losses. The use of the remaining 7 selections are shown in Figure 15; number of individuals in ( ), bar length represents average loss level of those individuals using each method. Those to left of green dashed line had better than average survival.
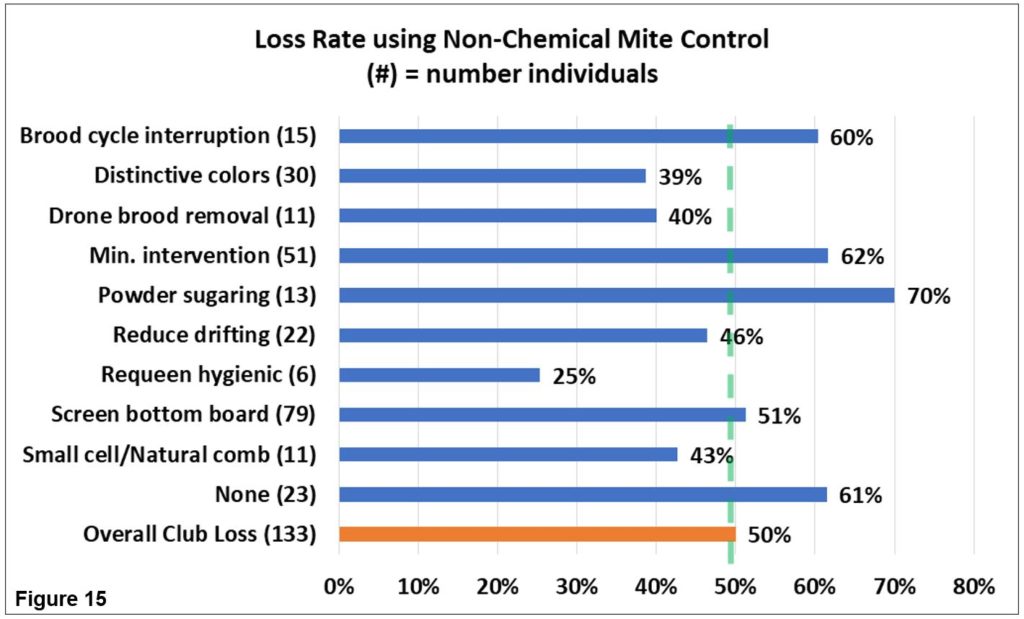
Five of the non-chemical alternatives demonstrated reduced losses this past year – requeening with hygienic queens has not been showing better survival in previous years while drone brood removal (11 individuals) and painting hives distinctive colors has resulted in better survival in each of past two survey years. Small cell/natural comb likewise has not been demonstrating better survival although this year there was a 7 percentage point improvement in survival for the 11 individuals using this technique.
Chemical Control: For mite chemical control, 35 individuals (26 ½ % of total respondents) used NO chemical treatment; these individuals had a 63% loss level. Those using chemicals used at rate of 1.5/individual. Fifty two individuals (56%) used one chemical and had 50% loss, 31 used two and also had 50% loss, 10 used 3 (only 15% loss). Fifty one individuals (55% of total chemical uses) indicated they most commonly utilized Oxalic acid vaporization and had improved survival. Six used Oxalic drizzle and two the oxalic with shop towel application and they too had better survival. Apiguard and Apivar users had improved survival. Figure 16 illustrates number of uses ( ) and bar length indicates the loss rate for those using that chemical.
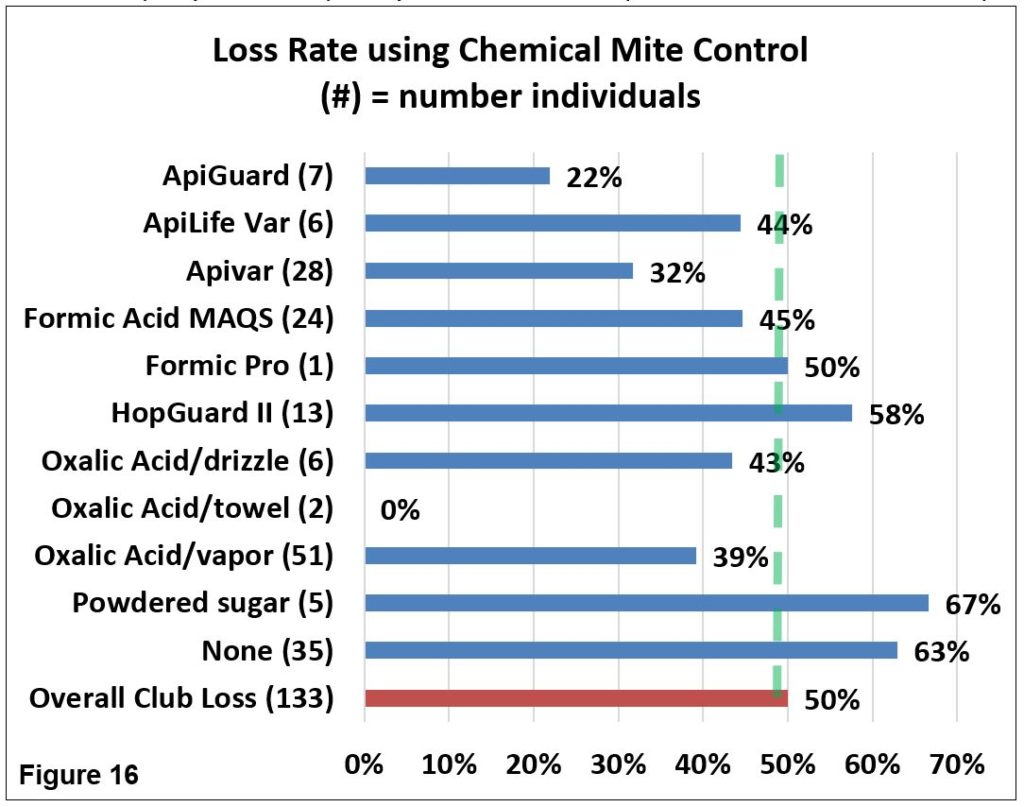
Consistently the last 3-4 years five different chemicals have helped beekeepers realize better survival. The essential oils Apiguard and ApiLifeVar have consistently demonstrated the lowest loss level. Apiguard has a 31% better survival and ApiLifeVar has a 30% better survival record over past 4 years. Apivar use, the synthetic (amitraz), has demonstrated a 29% better survival over past 4 years (2016-19). Oxalic acid vaporization over past 3 years has a 13% better survival (the survey did not differentiate Oxalic vaporization from drizzle in 2016). Formic acid demonstrated a 14% better survival but this product has changed and how we use it is changing so this information is more difficult to tease out of the data. This past season for example Formic Pro seemed to perform better than the traditional formic MAQs pads, although the one identified user of Formic Pro did not have improvement this year.
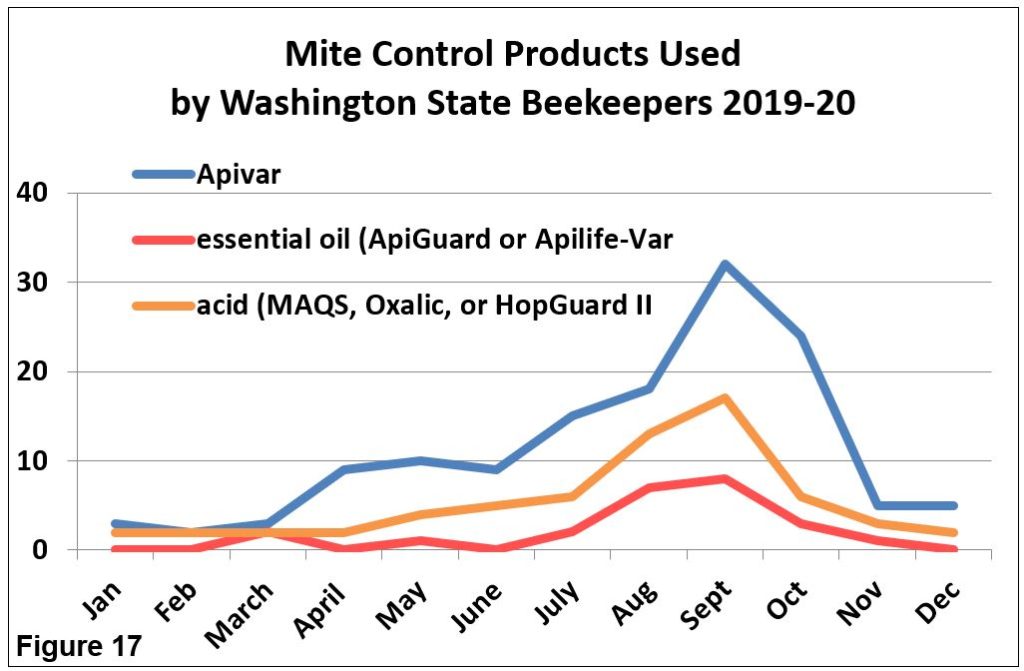
The monthly use of Apivar (blue line), essential oil (red line) or an acid (green line) is shown in Figure 17. Further review is needed to determine if the timing of treatments was more effective than at other times for the various chemicals.
Antibiotic use
Five individuals (9%) used Fumigilian (for Nosema control); their loss rate was 53%, slightly higher than overall loss level. Two used nosevet in addition (43% loss, slightly less than average). Three individuals indicated use of terramycin (7% loss) and one said they used Tylan (zero loss) for bacterial brood disease control.
Queens
We hear lots of issues related to queen “problems”. In Section 8 of the survey we asked what percentage of loss could be attributed to queen problems. Forty six individuals (39%) subdivided queen related issues from 10 to 100% of their hives; the majority (25 individuals) indicated 10 to 30%. Forty six individuals also said none; an additional 26 individuals (22%) said they didn’t know. The number of respondents and percent losses of each is shown in Figure 18.
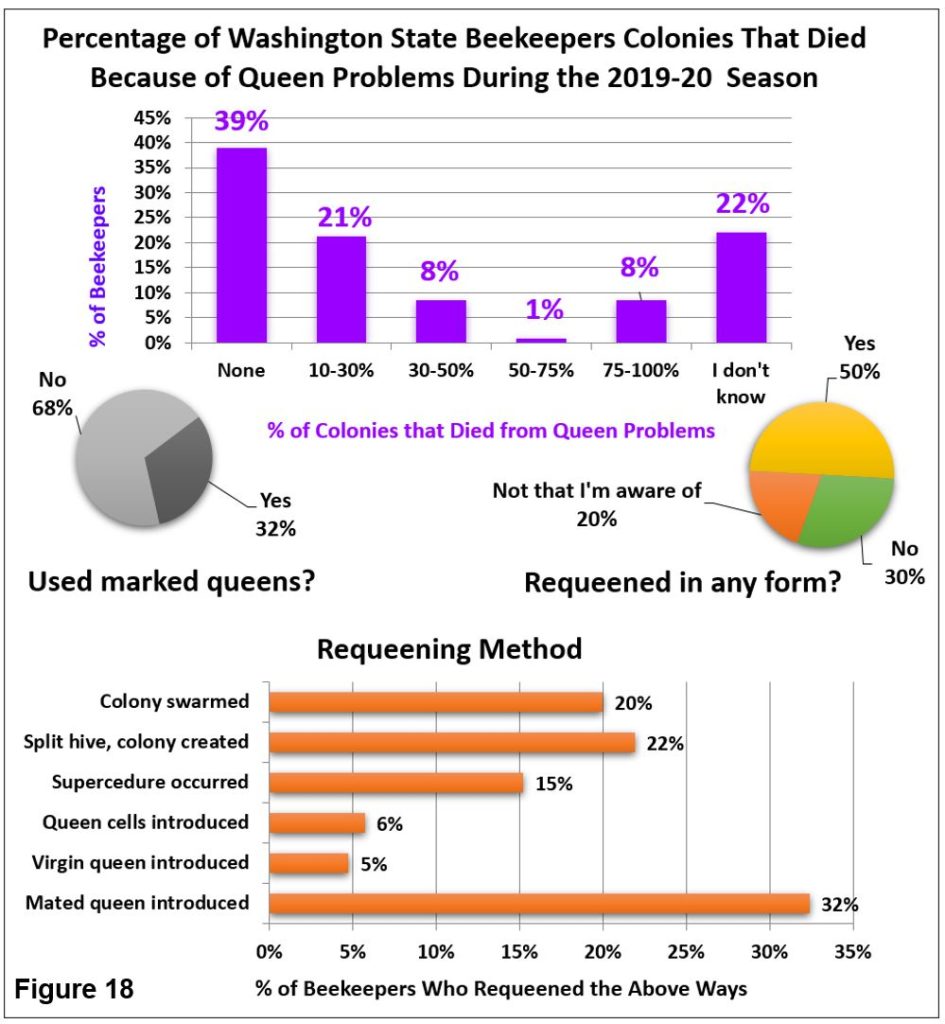
Queen events can be a significant factor contributing to a colony not performing as expected. We asked if you had marked queens in your hives. Only 28% said yes. The related question then was ‘were your hives requeened in any form?’ to which 50% (64 individuals) said yes, 30% said no. and the remainder ‘not that that I am aware of.’ May we then pose the obvious question … If 2/3rds of the beekeepers are not marking their queens then how can they be sure their loss was due to queen problems?
One technique to reduce mite buildup in a colony is to requeen/break the brood cycle. The question “How did bees/you requeen“ received 92 responses (more than one option could be checked). as illustrated in Figure 26. Twenty three individuals indicated they requeened with a mated queen and they had a 51% loss level, seven used a virgin queen (43% loss) and 8 used a queen cell (45% loss). A higher percentage (54 instances vs 38) said the bees requeened via Supersedure (15 instances, 46% loss), splitting (21 individuals, 63% loss) or swarming (18 individuals, 42% loss). With the exception of use of mated queen and splitting, loss levels were very similar.
Closing comments
This survey is designed to ‘ground truth’ the larger, national Bee Informed loss survey. Some similar information is additionally available on the BeeInformed website www.beeinformed.org and individuals are encouraged to examine that data base as well. Recall that the BeeInformed survey is reporting losses of the larger scale WA beekeepers not the backyarders (Figure 5). Reports for individual bee groups with 18 or more respondents are customized and posted to the PNW website.
We intend to continue to refine this instrument each season and hope you will join in response next April. We have a blog on the pnwhoneybeesurvey.com and will respond to any questions or concerns you might have.
Thank You to all who participated. If you find any of this information of value, please consider adding your voice to the survey in a subsequent season.
Dewey Caron & Jenai Fitzpatrick, June 2020