Below are the overall PNW Honey Bee Survey reports. Dr. Dewey Caron has also prepared Individual presentations and reports for each Beekeeping Association that can be viewed here . More will be uploaded as they become available. … Stay tuned & visit often!
Winter Bee Losses of Oregon Backyard Beekeepers, 2014-2015
by Dewey M. Caron with analysis assistance of Jenai Fitzpatrick
Overwintering losses of Oregon backyarder (small-scale) beekeepers was reduced in 2014-2015 compared with the two previous overwintering periods. This was perhaps due to the mild winter and early spring, very different weather compared to the previous two seasons.
This report presents the results of the 7th season of loss survey of small-scale Oregon backyard (small-scale, hobbyist if you prefer) beekeepers. The survey was conducted electronically (see: 2015 PNW Survey(Online) & 2015 PNW Survey (PDF) to view survey), supplemented with paper surveys distributed at late-March and April local association meetings. In all, 250 valid surveys were returned and tallied, 230 from Oregon.
Section 1: Characterization of Survey Respondents
The majority (75%) of the 250 respondents kept bees in the Willamette Valley of Oregon. The highest representation of the Valley groups was by Portland Urban (PUB) with 53 individuals and Lane County (Eugene) with 46 individuals , Figure 1. Outside of the Willamette Valley surveys were received from 12 Southern Oregon individuals, 12 Klamath Basin individuals, 6 Tillamook County/coastal Oregon individuals, and 6 Central Oregon individual beekeepers. Washington representation saw 13 Clark County beekeepers and 7 Lewis County beekeepers this year. Eleven additional Washington small-scale beekeepers sent responses to an abbreviated (loss data mainly) mailed survey instrument.
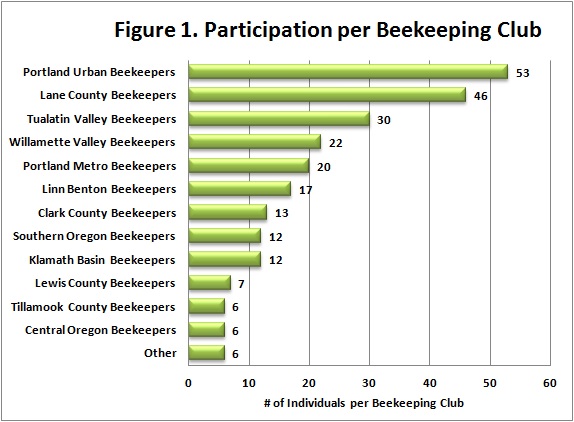
Membership affiliation does not mean all respondents were dues paying member of a local association. Some responses, not indicating a local association, were placed into a group based on geographic location of primary apiary.
Twenty beekeepers were from Washington County groups in Clark and Lewis Counties within the I-5 corridor of western Washington. Seven of the 250 respondents were new beekeepers with 2015 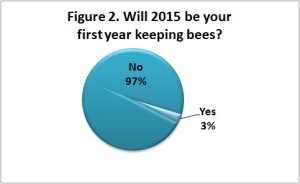 as their first year of keeping colonies (Figure 2). A Washington report of backyard and our related survey results of commercial/semi-commercial beekeepers will be published mid-July in the Washington Beekeepers Newsletter.
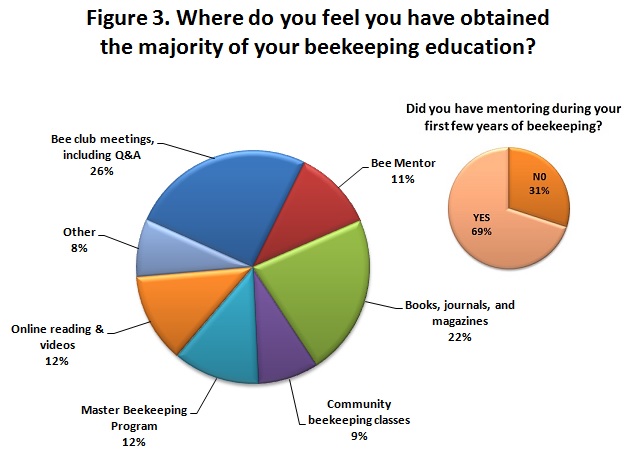
In this snapshot of our industry, we asked individuals to identify the major source of their beekeeping education (Figure 3). Bee club meetings and information obtained from books, journals and magazines each were responses of over 20% of respondents. This response varied from as high as 50% for bee club meetings, namely Klamath and WVBA groups, to 37% for reading obtained within the TVBA group. Bee mentors were selected by 11%; although in a separate question 69% of respondents indicated they had such a resource available during the first few years of their beekeeping. Obtaining information from a mentor could also have been part of the same reason 12% of participants checked the Oregon Master Beekeeper program as their primary source of beekeeping information. This question was a difficult one to answer for respondents as they were often unable to identify a single major source of their beekeeping education. This question may be modified in future survey to suit multiple parameters.
To better characterize the respondent population, we asked how many colonies and how many years of beekeeping experience individuals had. The majority of individuals (62%) completing a survey had 1, 2 or 3 colonies with a range of 0 to 50. The median number of colonies was 3, and the average was 4.2 colonies per individual. A small percentage (10%) of respondents had 10 or more colonies.
Nearly half the respondents (48%) listed that they were relatively new to beekeeping with 1, 2 or 3 years experience. The median years of experience were 4, and the average was 6. A smaller percentage (12%) of respondents had ten years or more of experience with 2 individuals listing 60 years experience. 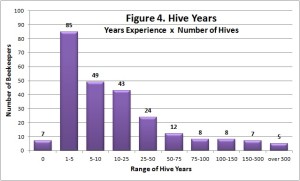 These numbers were used as a measure of intensity and experience in beekeeping referred to as Hive Years which is obtained by multiplying the number of hives by number of years of experience. As evident in Figure 4, 74% of this respondent population had 25 or fewer HiveYears.
Section 2: 2014-2015 Overwinter Losses, Based On Hive Type
The 243 individuals that were active beekeepers indicated they started the winter with 1131 fall hives and then counted 800 in the spring. Thus total overwinter losses were 29.3%. NO LOSS overwinter was experienced by 48% of respondents whereas 23% lost ALL of their fall colonies. For the 230 Oregon only respondents totaling 997 fall colonies, the loss rate was 28.6%
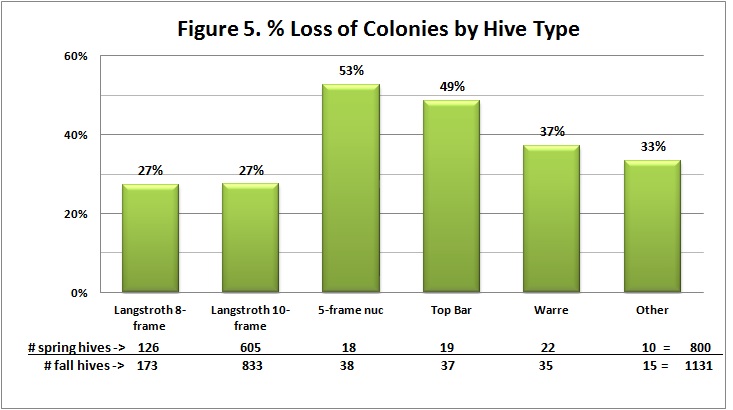
The loss statistic was developed by our asking number of fall colonies and number in the spring by type of hive they were maintaining; Results are shown in Figure 5. Winter losses of 8 and 10 frame Langstroth hives were both 27%, Five frame nuc hives had double that loss rate at 53%, top bar hives nearly double at 49% loss rate. Warré and “other” hive types half again as large with loss rates at 37% and 33% respectively. The Langstroth hive type accounted for 89% of total hive numbers. Among the 15 “other” hive types, 5 were Long hives. The most repeated loss number was the loss of 1 colony experienced by 91 individuals. While the heaviest individual loss was 14 colonies, slightly over half of those surveyed lost 1, 2 or 3 colonies.
Section 3: Loss Rates at Different Locations
We asked loss related to location of the hive. Eighty percent of respondents kept bees at a single location. Of those with multiple locations, 96% had one or two apiaries; up to 6 apiary locations were reported for two individuals. Loss numbers and loss rate for 1st and 2nd locations were similar at 29.8% each. Information supplied on location will be used for a spatial analysis study whose report and maps similar to those prepared last year by Jenai Fitzpatrick, see 2014 survey maps on www.pnwhoneybeesurvey.com are forthcoming.
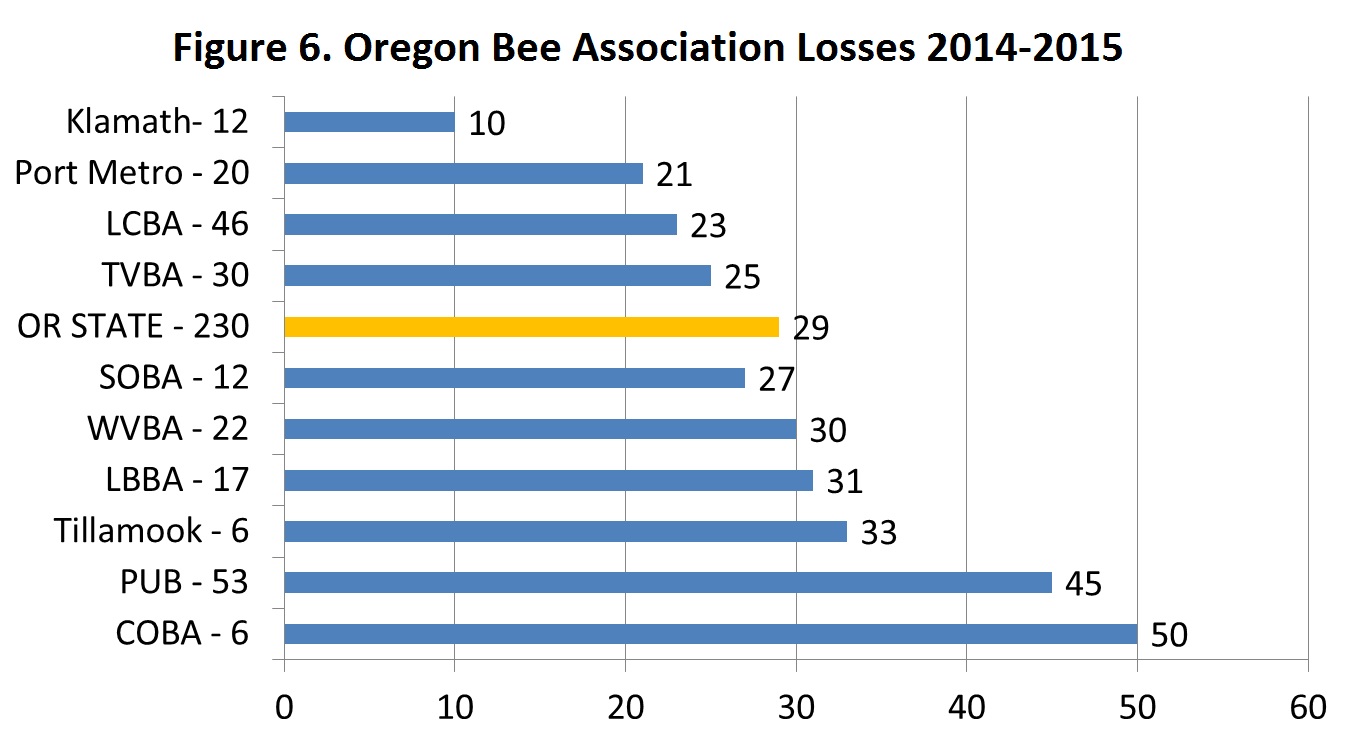
Overwinter losses of members of different organizations are shown in Figure 6. The numbers varied from a low of 10% for the 12 members representing the Klamath Basin beekeepers to a high of 50% for the 6 respondents from Central Oregon. In Washington, Lewis County had 19% loss rate (7 respondents) and Clark County had a 43% loss (13 respondents). The numbers to right of group name indicate number of respondents.
Comparison to Larger-Scale Beekeeper Losses
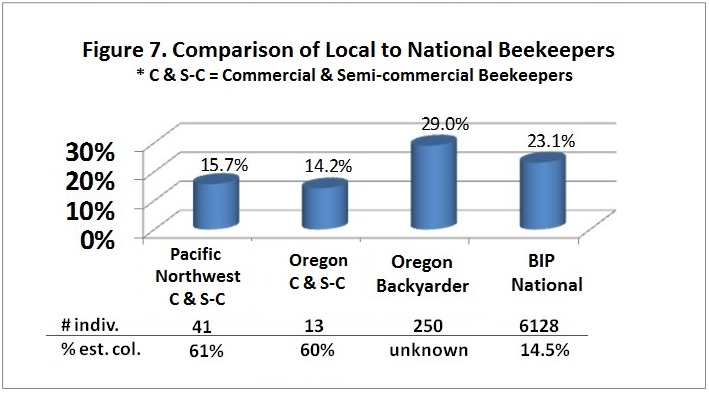
A different paper survey instrument was mailed to Pacific Northwest (PNW) Semi-Commercial (50-500 colonies) and Commercial beekeepers (500+ colonies) asking about their overwintering losses. Nine Oregon Commercial beekeepers, with average number of 4197 colonies, had a 12.4% loss rate and 4 Semi-Commercial Oregon beekeepers, with average number of 422 colonies, had a loss rate of 31.7%. Combined Commercial and Semi-Commercial beekeepers encompassing approximately 39,035 colonies, which is 55% of the estimated total number of colonies in the state, has losses of 13%. Factoring in the 997 colonies of 230 backyarders, the combined loss rate for Oregon beekeepers over the 2014-2015 winter was 13.4%.
For the 3-state region, 41 PNW Commercial and semi-commercial beekeepers (representing approximately 60% of the colonies of the 3 states) had a loss rate of 15.7%. The 2015 Bee Informed national survey estimated Oregon beekeeper losses at 25.2%, Idaho at 33.3% and Washington at 39.3%. Over 6000 beekeepers, both small and large-scale completed the national survey, which maintained nearly 15% of total estimated colonies in the U.S. Comparisons are shown in Figure 7.
A total of 29 individuals (12%) indicated they moved at least one of their colonies this past season. There were many reasons for thisaction. 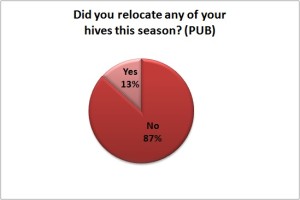 Seven moved for a better location, five to pollinate, 4 needed to move due to neighbor “issues”, and four moved splits/swarms away. A couple moved their apiary when they moved, or to move away from bears, to supply a friend with a colony or to reduce number at the primary apiary site.
Section 4: 2014-2015 Overwinter Losses, Based On Hive Origination
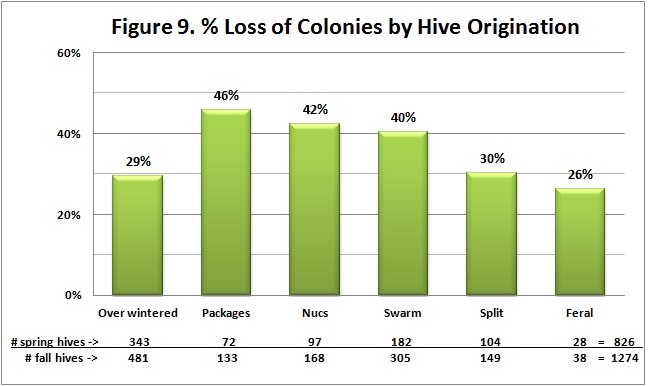
We also asked survey respondents to characterize their loss by the hive origination. The result is graphically presented in Figure 9. Package installations, nucs and swarm captures, in that order, were all least successfully overwintered with loss rates of 40% or more, while splits, feral hive transfers and overwintering colonies had fewer loss rates. Worth noting is that the loss level by hive origination here is slightly higher than when computed by hive type of section 2. We feel the section 2 data, rather than by origination, is most representative of loss rate calculation this past winter.
Section 5: General Hive Practices
We asked in the survey for information about some managements practiced by respondents. Multiple responses were encouraged.
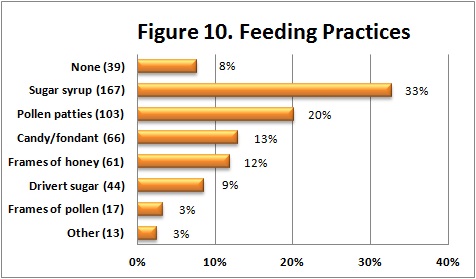
Feedings: The 510 responses are shown in Figure 10. Thirty nine individuals (8% of total responses) did not do any of the options offered. Feeding sugar syrup (33%) and feeding pollen patties (20%) were the most common feeding managements. Feeding fondant/candy (13%) and frames of honey (12%) were next most common with drivert and frames of pollen less commonly fed. Under “other,” dry sugar, dry pollen, and honey as a liquid were indicated. See also the subsequent article on fall feeding at our blog site.
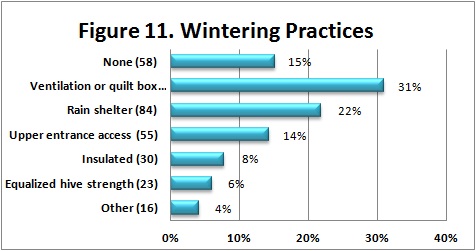
WINTERING PRACTICES: We received 385 responses about wintering management practices, again more than one option could be chosen. Fifteen percent of the responses indicated none of the several listed wintering practices were done, Figure 11. The most common wintering management selected was ventilation/use of a quilt box/insulating board at colony top (31%). Use of a rain shelter was next most common (22%), with upper entrance (14%) receiving the same response rate as doing nothing.
Our language was not apparently very clear as additional items were also listed. Most frequently (14 individuals) specified insulation specifying thicker lumber for box or lid construction or use of lid with moisture trap or special insulated cover yet insulated and ventilation/quilt box was a check box option. One indicated use of a wintering shed, another specified colonies were tilted forward, another that weak colonies were combined to stronger in the fall and 3 individuals each said they added a mouse guard or provided a winter wind break. While this information can be useful it is best placed in the comments section at end of survey and generalized selection made for statistical purposes. This is a typical item we will continue to develop in future surveys.
SANITATION PRACTICES: It is critical that we practice some basic sanitation in our bee care. We probably do too little to help insure healthy bees. We received 440 responses for this survey question. Ten percent said they did not practice any of the 8 offered alternatives, Figure 12. Screen bottom board use (38%) was the most common option selected which was encouraging because bees need to get rid of diseased brood, pests and other potential negatives from within their hive.
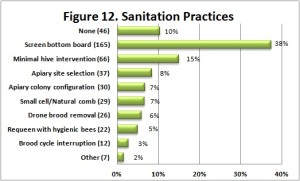 The screen bottom helps promote a “garbage pit” for getting potentially harmful organisms and materials out of the hive. The next most common selection was minimal hive intervention (15% of responses). Less intervention means less opportunity to compromise sanitation of a hive; needless inspections/manipulations can only interfere with what the bees are trying to do to stay healthy. Apiary site selection (8%) was slightly more common as a choice compared with small cell/natural brood comb, apiary colony configuration, drone brood removal, and requeening with hygienic bees (7% to 5%). Features listed under other sanitation measures were cleaning of hive tool between inspections, planting medicinal plants in apiary and replacing/cleaning moldy boxes/frames.
What we intend to do is compare individuals who had winter losses with those who did not have losses and their responses to these three categories of managements – feeding, wintering and sanitation. That information will be posted to this site as available.
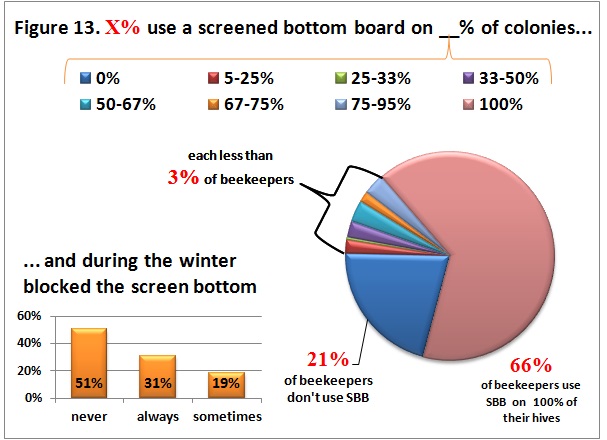
Screen bottom boards: In our national BeeInformed (BIP) surveys, fully 95% of respondents indicate they have modified colony bottom boards and now use a screen bottom board. We asked what percentage of Oregon backyard beekeeper hives had screen bottom boards and whether they were blocked during the winter. Twenty-one percent said they did not use screened bottoms; 66% used them on all their hives. The majority (51%) left them open over the winter period (never response), 18% sometimes blocked them and 31% said they closed them (always response) during the winter.
Section 6: Mite Monitoring/Sampling and Control Management
We asked percentage of hives monitored for mites during the 2014 year and/or overwinter, whether sampling was pre- or post-treatment or for both pre and post-treatment and by which of the five possible sampling methods was that tool used. 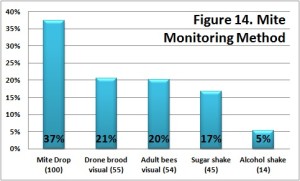 In order of popularity of use Sticky boards was used by 37%, with visual inspection of adults and drone brood about the same (20%), Figure 14.
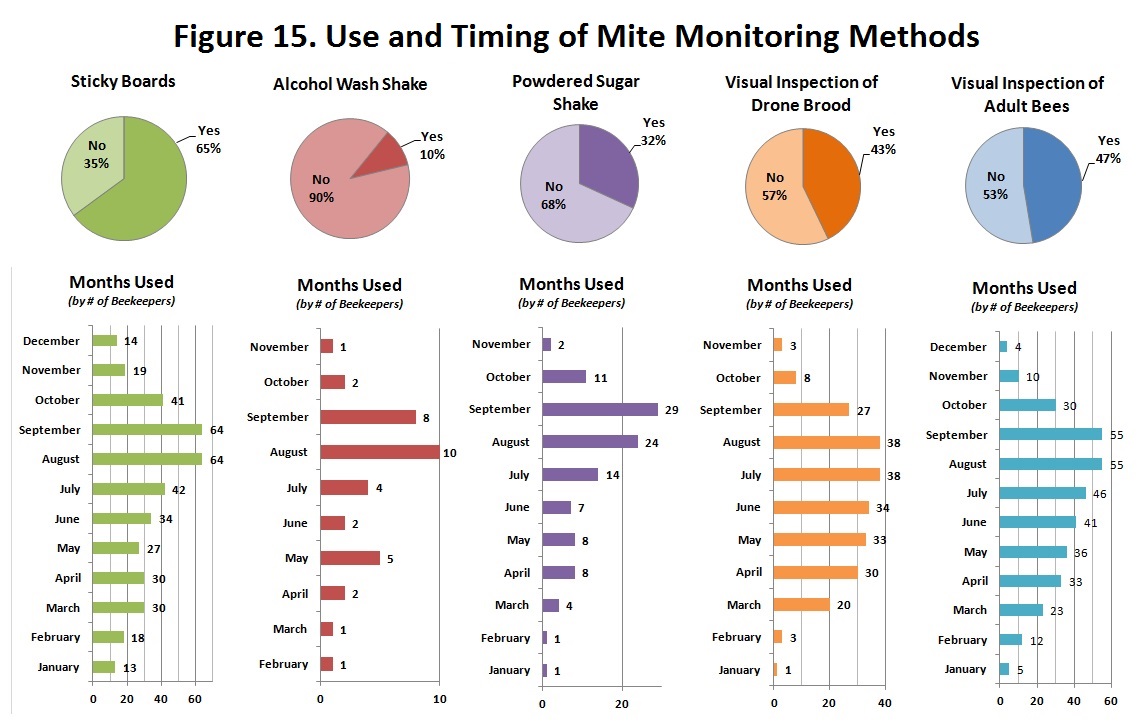
Washing adults with powdered sugar was indicated three times as frequently as use of alcohol wash (17% vs. 5%). Most of the sampling was done in August, September and October as might be expected, Figure 15.
Section 7: Use of Medications and Control Treatments
We asked about general mite treatments and also about use of chemicals for mite control, more than one selection was permitted. Under general controls, 12% (49 individuals) said none of the nine alternatives were used, Figure 16. 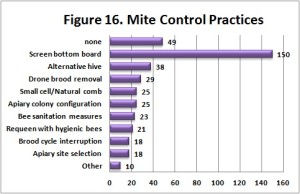 For the respondents who checked at least one choice other than none, use of screened bottom board was listed by 150 individuals, 42% of respondents did indicate use of at least one of the techniques. The next most common selection was use of an alternate hive (11%). The remaining 7 selections were indicated by fewer than 30 individuals each; drone brood removal was the most indicated of these. Listed under “Other” were grease patties (a tracheal mite control) and powdered sugar (an ineffective varroa control method).
Six individuals of 144 that responded (4%) 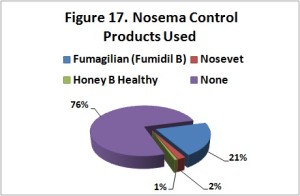 indicated they fed terramycin for foulbrood disease. While the majority listed no treatment for Nosema disease control, thirty individuals (21%) indicated use of Fumigillan, Figure 17. Three used Nosevet and one Honey Bee Healthy.
For chemical control 215 responses were indicated. 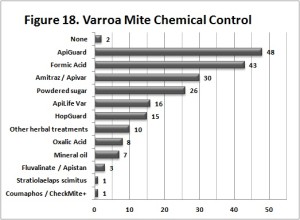 The most commonly checked alternatives were Apiguard (22%), followed by formic acid (20%), Figure 18. Apivar (amitraz) was the third most common, used by 30 individuals (14%) followed by powdered sugar (12%). Others as shown were used by 16 or fewer respondents, less than 10%.
Section 8: Queens
We are not satisfied with our questions about queens on this year’s survey. 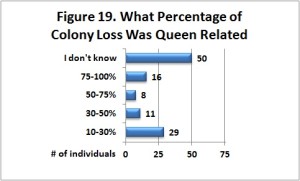 We asked what percentage of your colonies lost do you feel died because of queen problems, Figure 19. The largest response was I don’t know (39%) which was followed by 10-30% at 29%.
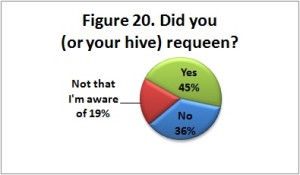 Our subsequent questions asked “Did you, or did your hive requeen, in any form during the year”. Of 243 responses, 87 (36%) said no, 46 said ‘Not that they were aware of (19%) and 110 (45%) responded yes, Figure 20.
This was followed up with one hundred seventy seven individuals responding to the question “If you did requeen, how did you do it.” 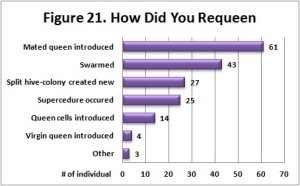 The largest response was mated queen introduced (34.5%) followed by colony swarmed (24%). The data’s interpretation to this string of questions isn’t as clear as originally intended and will likely be modified in future surveys.
Section 9: Colony Death Reason and Acceptable Level
We asked of those individuals that had colony loss to estimate what the reason might have been. Multiple responses were permitted. Of 276 responses, 45 chose weak in the fall (16%), 40 selected Varroa mites (15%) and 38 said queen failure (14%), Figure 22. I don’t know was also 14%, Starvation and poor wintering conditions each were 9% , yellow jackets were 5% and 4 individuals said pesticides and 2 listed nosema disease. 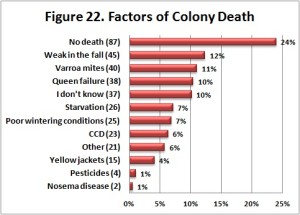 Listed under “Other” were natural predators such as bears, mice, and skunks along with robbing, moisture, and pollution which might have been better categorized in the general options. Finally a few respondents attribute virus, and late start or growth issues to the death of their colonies which again might fall into the mite, weak in the fall categories.
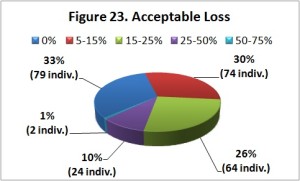 Respondents were asked to indicate what an acceptable loss level was to them and were offered several categories to select from. Thirty three percent (33%) said zero, 30% said 5-15% and 26% checked 15-25%.
Summary
As indicated we will further analyze the loss by managements, feeding/wintering practices/sanitation, as well as losses relative to use of control techniques and chemicals utilized. Some of this information is already available on the BeeInformed website found at www.beeinformed.org and individuals are encouraged to participate in those surveys and examine their reports as well.
Our reports for individual groups where twenty or more individuals participated will also be customized. They will be posted by the name of the group as they become available. We intend to refine this instrument with each passing season and hope you will join in response next April. As of this year we have a blog and will respond to any questions or concerns you might have via posts for all to share or emails which might be anonymously blogged for the greater community development and educational goals of this site.
Thank you to all who participated! If you found any of this information of value please consider adding your voice to the survey in a subsequent season.
Dewey Caron w/ Jenai Fitzpatrick
June 2015
A PDF copy of this 2015 Winter Bee Loss Report may be viewed here.
Pingback: July 2015 Beeline | Portland Urban Beekeepers
Pingback: July is Mite Checkin' Time! - Southern Oregon Beekeepers Association
Pingback: Good Record Keeping - Southern Oregon Beekeepers Association
Pingback: Keeping Good Records - Southern Oregon Beekeepers Association