Category Archives: Carons articles

Gnawing at the Propolis Between Now and Spring

Overwinter 2018-19 wintering loses, although variable, appear to be high again, the 3rd consecutive year. See for example Feb 18 NPR report “Massive Loss..” featuring Eric Olsen, Richard Adee and Ramesh Sagili. Hopefully when our winter weather breaks and better spring weather bursts forward you can begin spring managements and will find good survivorship. Here at PNWhoneybeesurvey we ask, whatever you find, to please share with fellow beekeepers via our online survey which will be open from March 15 continuing during month of April. It should only take a few minutes to share, especially if you have been taking notes. Reports will be posted on the same site – you can review 2017-18 loss/management reports for 304 Oregon backyard survey respondents, 104 Washington small scale beekeepers and for individual OR and WA Bee clubs. Thank you for your participation over the years and I look forward to seeing you at your local bee club meetings this spring!

Dr. Dewey M. Caron

Emeritus Professor of Entomology & Wildlife Ecology, Univ of Delaware, & Affiliate Professor, Dept Horticulture, Oregon State University

Comparison of PNW and BeeInformed Surveys

One objective in starting a record of PNW losses was to “ground truce” the BeeInformed loss surveys. Both BIP and PNW surveys include the same general population of beekeepers (mainly commercial for colony numbers and hobbyists for individual numbers) and annual average loss percentages are computed the same way.

In 1/2 of the states/years the numbers are in close agreement (under 5% difference) but curiously the most recent survey year results exhibits a considerable difference in average loss levels (8.5% or above).  The BeeInformed average loss results for 2017-18 winter losses are 8 plus percentage points higher (for Washington) or lower (for Oregon and Idaho) than the PNW survey results.  The table on next page includes the summary numbers of % loss, number beekeeper respondents, number colonies they maintained in the fall of the year and, in red, the difference in winter loss average between the two surveys.

For the most recent BIP survey, 122 survey-returning OR beekeepers, with 19,232 colonies had an average loss of 24.8%. In the PNW survey, 319 OR beekeepers, managing 45,524 colonies had an average 15.9% overwinter loss.  The loss difference is  8.6%. The BIP survey with a smaller number of beekeeper respondents and colonies managed reported higher estimated loss. In  Idaho, the  difference  was a 8.9% reported loss difference. BIP survey of 34 individuals (managing 11,099 colonies) reported a 25.9% loss while PNW survey, of 21 individuals managing 52,010 colonies had a loss of 17%. As in Oregon, the PNW survey reported the lower loss level.

BeeInformed and PNW survey results also differed by the same approximate margin for Washington beekeepers this past survey season but the PNW survey reported the heaviest loss rate.  BIP winter loss rate was 21.4% (139 beekeepers managing 52,531 colonies)  while PNW survey average loss rate was 28.4%; it included 24 fewer beekeepers managing 25,959 fewer colonies.

The lower reported losses in Oregon and Idaho might be due perhaps to the PNW sample including a higher proportion of commercial/semi-commercial beekeepers with fewer in Commercials represented in Washington PNW returns. Commercial beekeepers in all 3 states typically have lower loses, by 50% or more, compared to smaller-scale beekeepers. In Oregon and Idaho the colony numbers of respondents are greater while the reverse is true for Washington individuals and this too could have impacted the loss percentages.

In three previous survey years, a large differential in average overwinter losses of the two surveys also was reported when there was a big difference in number of individuals or/or number of colonies managed by survey respondents. For example in the previous year (2015-16) survey) in Oregon, the BIP survey reported 5.6% lower loss level (the BIP respondent pool was 133 fewer individuals and 5855 fewer colonies). For Washington, there was a 9.7% difference in the two surveys in 2015-16 when the BIP survey, although  including 73 more beekeepers, had 4944 fewer colonies. In the same year, Idaho loss differential of 6.8%; The BIP survey included 34 more beekeepers managing  3,942 more colonies.

Why the most recent survey year differences are so different is not known. Generally the loss level numbers reported by the two surveys do “track” and if sample sizes are considered can be explained when the differences are over 5 percentage points.

Dewey M. Caron 7/9/18


2O18 overwinter Losses of backyard beekeeper with 10+ colonies

by Dewey M. Caron

The OR and WA beekeeper small scale beekeeper survey respondents www.pnwhoneybeesurvey.com are mostly 1-4 colony holders but there are several that have 10 or more, up to 50 maximum, colonies. One question I get is what about the losses of these small scale beekeepers who have  “larger” colony numbers – do they have higher losses? The short answer is NO.

For WA backyard beekeepers, 40.5% had 1 or 2 fall colonies and 26% had 3 or 4. The Medium number was 3 colonies, simple average of total 104 WA beekeepers was 4 colonies/individual. In Oregon of backyard beekeepers, 61% had 1 to 4 fall colonies. Medium number was 3 colonies and simple average of 303 Oregon OR beekeepers was 4 colonies/individual.

For the 2 PNW states, survey responses from 12 commercials (simple average 5826 colonies/individual), 11 individual semi-commercial beekeepers (average 128 col/individual) and 407 small scale beekeepers (simple average 4 colonies/individual) were respectively 19%, 28% and 40% overwinter losses.

For the 400+ OR/WA small scale beekeepers, 33 individuals (8%) had 10 or more colonies (24 OR and 9 WA beekeepers). Their range of losses was 0 to 85%. Medium and average loss was 20%. Of these 33 beekeepers, 7 OR and 1 WA (2% of total number of small scale beekeeper respondents in the two states) had losses above the overall loss rate (for Oregon that was 38% and Washington 44% average overwinter loss.)  Individual losses of these 7 individuals ranged from 57% to 85% of fall colonies. Medium and average loss was 67% for these 8 individuals

Looking at years experience, the range of individuals managing 10 or more colonies was 1 to 40 years experience; 15 (almost 50%) have 10 or more years of beekeeping experience. For the 104 Washington backyard individuals 65% had 1 to 4 years experience and for Oregon’s 303 small scale beekeepers, 56% had 1 to 4 years experience

Table on next page shows number of individuals by fall colony size (10+ colonies), their loss percentage and their number of years of beekeeping experience. Losses in red are the 8 individuals with heaviest losses.

It is clear that smaller scale beekeepers with 10+ colonies (up to 50) did NOT have higher losses compared to majority of the backyard beekeeper respondents in the two states.

Mite Monitoring – it does make a difference

by Dewey M. Caron

Varroa mites continue to change the beekeeping landscape. In the ‘good ‘ol days’ it was far easier to start a bee colony and keep them alive than today. After introduction of the varroa mites into the U.S. (1987), there was an unprecedented rapid approval of tau-fluvalinate pesticide by EPA for in-hive mite control. And the resulting miticide Apistan® worked very well in killing mites.

Unlike the tracheal mite, varroa mite did seem to be controllable at first. Beekeepers changed from a chemophobic attitude about pesticides (chemicals around bees were to be avoided – ‘feared’) to chemophilic (chemicals were tolerated/useful – ‘liked’). But all too soon we began to understand the ‘unintended consequences’ to the hive environment and our honey bees when we began putting a pesticide inside a bee colony. We seriously contaminated our beeswax with the miticide and mites developed resistance to this chemical within several years meaning it became ineffective.

The subsequent generation of pesticides (Coumaphos – an organo-phosphate compound, developed to kill enemy soldiers in war-time) and Hivestan (fenpyroximate pyrazole) were even more detrimental in the bee environment and mites even more rapidly acquired resistance. Current sole synthetic miticide Apivar (amitraz), although generally not as harmful to bees or their environment, is showing signs of mites developing resistance to it as well.

A mite management concept has begun to creep into our language – IPM, Integrated Pest Management. IPM fits with the concept that it is not practical (impossible) to kill every last mite in our colonies (nor possible to keep them out) but rather we should seek to manage the mite population at a level that is minimally damaging. As we manage the honey bee population for gain, we need to incorporate and integrate mite management – an integrated control program.

The question beekeepers need ask is NOT does my colony(ies) have mites? but rather HOW MANY mites does my bee colony(ies) have? To determine how many means varroa mite monitoring, a crucial first step of an IPM management program. When we determine HOW MANY we become better informed bee colony stewards. HOW MANY helps us know the risk of doing nothing and helps us target seasonally appropriate control(s) to slow mite population growth with goal of keeping mite populations at less damaging, more tolerable levels.

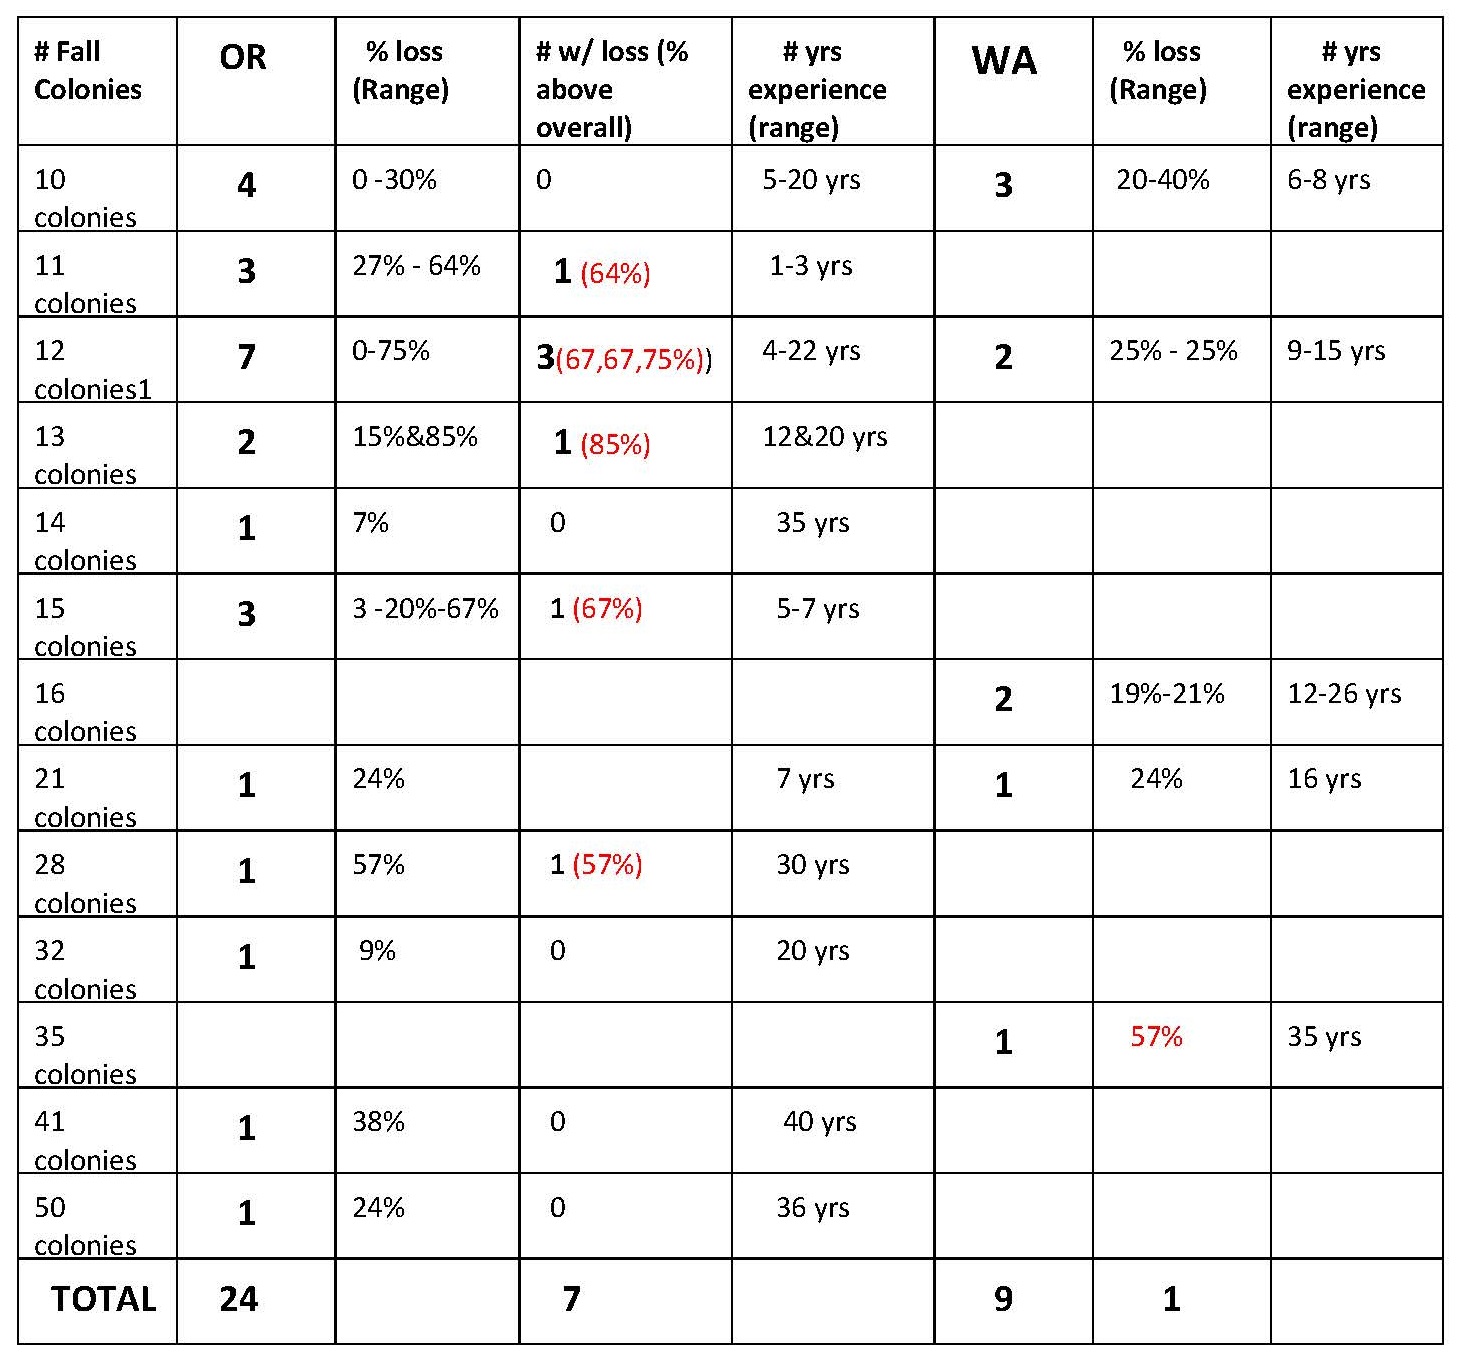
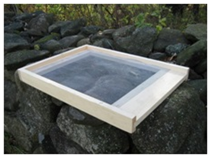
One early (alternative) non-chemical mite control treatment was use of Screen Bottom Boards. With widespread adoption of screen bottom boards in place of solid boards, a whole industry developed incorporating mite monitoring 
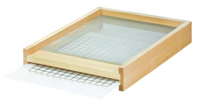
sticky boards beneath the bottom screen (one example shown at right). There were attempts in Georgia, Washington State, and by myself in the Mid-Atlantic States, to determine how best to count fallen mites with a sticky board and how to interpret the numbers – a threshold was developed.

This threshold number has been modified as we have learned that mites vector and enhance viruses. Initially 50 mites per days was a threshold. The number has been lowered, initially to one per hour (24/day) and now one per every 2 hours the mite board is in use (12/day). If boards collect more mites the risk to the colony increases with higher mite fall.

Currently 79% of beekeepers responding to the PNW winter colony loss survey indicate they use a screen bottom board as a mite control technique. (see Screen Bottom Boards – a 4 year perspective  Report posted to www.pnwhoneybeesurvey.com). However after 4 years of survey data for Oregon and Washington small-scale beekeepers, a clear picture emerges that screen bottoms aren’t very useful in reducing mites:

The four year average – 41.3% winter loss level of those using SBB  vs 43.4% loss level for those not using SBB – represents a mere 5% gain (i.e. improved winter colony survival) with screen bottom boards.

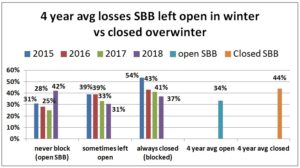
A constant discussion has been should the colony bottom be left exposed during winter or should the screen be closed as a winterizing management? Closure was often achieved by using a mite monitoring board with the screen bottom. Four years of survey data tallying the always and sometimes left open response compared with the closed in winter response reveals:

10 percentage point difference in favor of closing the SBB over the winter period (i.e. less winter loss if the board is closed in the fall.)

How Best to monitor Mites

Beekeepers generally have available 5 methods to assess the mite population in their colonies. Sticky boards were initially considered a good tool to do whole 
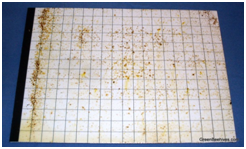
colony mite number assessment. However there are problems in use of this tool. Foremost with sticky boards, when used to asses mite colony population, was and remains how to quickly and accurately count the mites on the boards. Mites are tiny, sticky boards collect lots of debris and ants and other scavengers may remove fallen mites.

Natural mite fall (i.e. mite drop not enhanced with use of a control), can vary a great deal for a variety of reasons. Size of colony makes for variation, time of season, degree of auto-grooming behavior by bees and also how the boards are inserted and how long they are left inside adds to more variation. Efforts to reduce counting by sampling only a portion of the drop proved impractical as a large portion of a sticky board still needs to be counted to obtain an accurate assessment.

Sticky bottom boards are useful in providing a quick ‘snapshot’ as to whether there are few or many mites in a colony. It can help validate the effectiveness of a control that was used if utilized post-treatment. They are not adequate to provide a precise estimate of mite population without accurate, time-consuming counting and multiple, repeated sampling.

BOTTOM LINE: Screen Bottom Boards are not an effective mite monitoring method

More problematic as monitoring tool is using a visual method of counting number of mites. This is used for colony worker adults or number of mites within drone brood cells. The phoretic mites, (i.e. those on the adults), are highly mobile and some of the mites are deeply embedded between body segments to enable them to feed on adult hemolymph and fat body. Their deep reddish color and compact flattened body means they blend into the adult color patterns.

The counting of reproductive mites within drone cells has proved to be highly variable. The reproductive female mites are easier to see on the white drone pupae (compared to adult bodies) and sampling of drone pupae within capped cells with use of a cappings scratcher is easy. However numbers are not easily correlated to the actual population level within the colony.  One serious drawback with this method is during the fall months, when mite population assessment is most critical, there are often no or few capped drone brood cells available to assess.

BOTTOM LINE: Visual mite monitoring methods are not effective enough

Thus today we believe counting of the mites on the adults by washing the adults to remove their mites (the feeding mites as well as those ‘riding’ the adult) to be the “best” method. Our two recommended methods are the use of powdered sugar or using alcohol (or a non-sudsing soap). Use of powder sugar allows return of adult bees back into their colony whereas the alcohol/soap kills the sampled bees. See Tools for Varroa Guide on website www.honeybeehealthcoalition.org

Generally a sample size of 300 adults, collected from a brood frame, is recommended. The adult bees can be collected directly into a wide-mouthed sampling jar, previously marked (by sample counting) to indicate 300 bees or the brood frame can be shook into a bucket or plastic container and a ½ cup size measuring cup filled with the bees to dump into the sampling jar. The solid lid of the sample jar is replaced by a 5-mesh screen.

If using powder sugar, a generous amount of powdered sugar (confectioner’s sugar) is sifted onto the sample and the jar vigorously shaken for a minute to thoroughly distribute the sugar and then left to stand for a minute or more to allow heat to build up in the 300 bees. If alcohol is used, add enough iso-propyl (rubbing) alcohol to cover the bees. The liquid is swirled and the bees thoroughly washed for at least a minute. DO NOT RUSH SAMPLING. The mites between the body segments of bees need to separate from their host’s body to get an accurate count. See accompanying photos.

USING powder sugar mite monitoring           Using alcohol wash mite monitoring

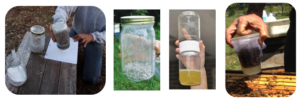
The sample jar with powdered sugar is then inverted and excess powdered sugar shaken out, along with the mites that had been on the adults. With the alcohol/soap, the mites will be in the liquid portion which can be poured from the sample through a filter, such as a coffee filter, for counting or simply counted in the bottom of liquid with adult bees held above the liquid at base.

The number of mites washed/sugared from the bee bodies is then converted to per cent number of mites for 100 bees (6 mites on 300 adults = 2% for example). The ‘threshold’ for decisions on continuation or initiation of control is currently 2-3% – this number too has been steadily decreasing. Some beekeepers like to keep the number below 1%. Repeat sampling can be done to confirm accuracy. When the sample is below 2-3% monitoring should be repeated to confirm mite population remains at a low level.

BOTTOM LINE: Washing adults collected from a brood frame using powdered sugar or alcohol/soap is the faster and most accurate mite monitoring method for assessment of mite population in colony

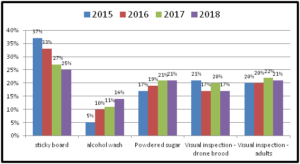
In 4 survey years the percent of OR/WA individuals using sticky boards as their monitoring tools has steadily decreased (from 37% of individuals using them in 2015 to currently 25% of respondents using them in 2018 survey response) while alcohol wash as a monitoring method has increased from 5% of reported use in 2015 survey to 14% in most recent survey.  Use of powdered sugar to monitor mites has also steadily increased although more modestly. These trends are shown in graph below for 4 survey years.

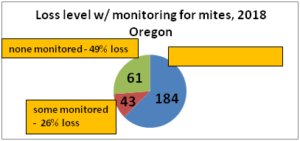
With our pnwhoneybeesurvey we ask percentage of OR hives monitored for mites, whether sampling was pre- or post-treatment or both and, of the 5 possible mite sampling methods, what method was used and what month(s) was it employed.  184 individual respondents (63%) said they monitored all their hives. When those individuals monitoring all their colonies was equated to the loss they reported, the loss rate was 38. Sixty-one (22%) individuals reported no monitoring and when paired with their loss had a loss level of 49% , 9 percentage points higher [43 individuals reported monitoring some of their colonies; they had a 26% loss]. Numbers are shown in Figure below.

Comparing the last 2 survey years there was a lower loss level, better winter survival difference of 8 percentage point lower losses (48.5% no monitoring vs 40.5% loss total monitoring all colonies.) This means a 17% advantage.

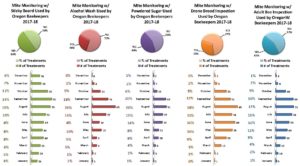
In the 2017-18 season, 68% of Oregon individuals used more than one sampling method. 32% of individuals used a single monitoring method (23 individuals used alcohol wash, 19 used sticky board and 18 powder sugar). Of those using multiple sampling methods, 39% used 2 methods, 24% used 3, 5% (10 individuals) used 4 and 1 individual used all 5. Sticky boards were used 108 times, at least once in each month. Alcohol wash was used the fewest times, 51 total and only 11 months with little utilization in an additional 3 months. Most sampling to monitor mites was done in July – September, as might be expected since mite numbers change most quickly during these months and results of sampling can most readily be used for control decisions. See graphic below illustrating monthly use for each of the 5 sampling methods.

Summary: Monitoring colonies for mites helps inform the beekeeper on HOW MANY mites (size of mite population) and with repeated sampling if the number is increasing or remaining level. This can key a decision on risk of doing nothing about mites (i.e. not using a mite control) and also can help confirm that a treatment (when sampled post-treatment) was effective in reducing the mite population. Of the several sampling methods the recommendation is to wash adult bee bodies, collected from the brood area of the colony, with powdered sugar or alcohol/soap. Mite number in sample should be below the 2/3% level to confirm there is a low risk of mite damage to the colony. Consult the Tools for Varroa Guide information on the website www.honeybeehealthcoalition.org for further information on sampling, the meaning of mite sample numbers and for information on mite control.

Download the PDF report here

Screen Bottom Boards: A 4 Year Perspective

Screen Bottom Boards (SBB) have a number of uses in our bee stewardship and are widely substituted for a solid bottom board.  A 1939 Delaware beekeeper removed his solid bottom and left his colony open at the bottom, which he termed “bottomless” beekeeping [There truly is nothing “new” in our beekeeping practices]. Although many beekeepers use SBB to control varroa, BIP and PNW surveys point out they are not a highly effective varroa mite control tool.

Our PNW Honey Bee Survey asked respond-ents about screen bottom board use. Among Oregon and Washington hobbyist (backyarders or small-scale beekeepers) in the 2014-15 survey year, 79% of the 250 respondents said they used screened bottoms (66% used them on all their hives with the remaining 
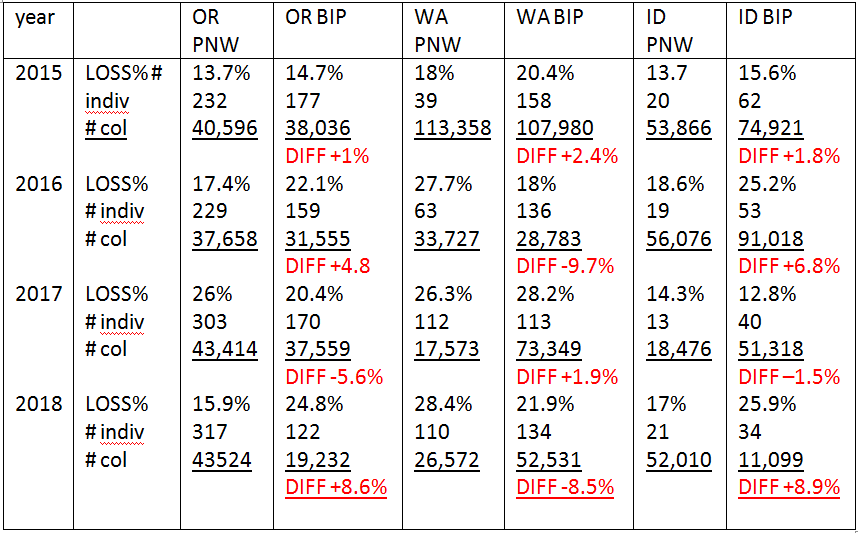
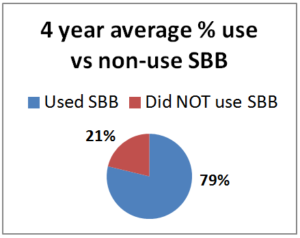
13% using them on a percentage of their hives).  In 2015-16 period, 140 individuals used SBB on all and 41 individuals used on some of their colonies (74.4%)  while 62 individuals DID NOT use SBB 25.5%). For  2016-17, 178 individuals used them on all their colonies and 46 did on some for a total use of 83%; 17% (47 individuals) DID NOT use them. For the most recent year 214 individuals used SBB on all their colonies, 40 on some =80% while 63 individuals did not use SBB 20%. The numbers have been consistent each year with range of use on all or some of hives from 74.4 to 83%.. The graph shows 4 year average of number of individuals who used SBB (79%) vs those NOT USING SBB (21%).

For each year comparing overwinter loss percentage of individuals using SBB on some or all of their hives with the smaller percent that did not use SBB revealed a small advantage to SBB use with slightly lower losses. In the 2014-15 season, there was a small difference of 2 percentage points for individuals NOT using SBB (27% loss rate) to those who used SBB (25%) on some or all of their colonies.   For 2015-16 there was a marked difference in favor of those who used SBB; the 17% who did NOT use SBB had overall loss average of 48% compared to 55.5% overall loss average of the 83% of individuals who used SBB on all or some of their hives. The difference was even larger in 2016-17 but opposite; for the 13.6 that did NOT use SBB, their overall average loss was 59.4% compared to the 46% loss rate of the 86.3% who used SBB on some or all of the hives.  In the 

2017-18 season, the loss rate of those using SBB on all or some of their hives was 38% vs a 39% loss rate form those 63 individuals not using SBB. In three of four years there was a slight advantage to use of SBB with 1, 2 and 13.4% greater survival rate. The four year average – 41.3% loss level of those using SBB and 43.4% for those not using SBB (a 5% gain) illustrates how they are very minor in improving losses overwinter survival.  

We also asked whether they blocked colony SBBs during the winter. IN 2014-15, the majority (51%) left them open over the winter period (never response), 19% sometimes blocked them and 31% said they closed them (always response) during the winter. For the next two seasons the majority response was to leave the screens open at the bottom of the colony overwinter. 2015-16 56% left open vs 26.5% closed and 2016-17 50% left open vs 31% closed. This past season 39% left them open, 17% sometimes did so and 44% closed them. When we examined winter losses for this response, there was an improvement in loss when the  SBB were closed  (24% vs 31% in 2014-15 for example, 39 vs 32% in 2015-16, 53.5% vs 36.6% in 2016-17 and 42% vs 37% this past winter.) Comparing the always blocked the over winter response with the never response and sometimes (left open) results in a 10 percentage point difference in favor of closing the SBB over the winter period.

With our Bee Informed National survey (www.beeinformed.org), use of SBB did not improve winter survival rate in any of our survey years when we directly compared their use with loss rates. However in survey year 2013-2014, northern beekeepers did have about a 10% decrease in losses when SBB were used compared to southern beekeepers. Experimental studies on SBB and mite population levels show either no or this slight, ~10%, improvement in reducing mite population levels when SBB are used.

So what can SBB do to benefit our bees?

A Screen bottom board is a multifunctional IPM tool. Using a screen bottom aids greatly in hive ventilation.  It can be used with upper entrances at the covers or with ventilation ports added to hive bodies. Air circulation for better ventilation can be further aided by pushing the outer frames inward a bit to allow air circulation upward between the outer frame and box wall. Heavy burr and brace combs, sometimes due to incorrect bee spacing between the hive boxes, when both the bottom bar and the dropping of the top bars below the rim creates a ½ inch of larger space, and heavy propolis use in the fall, may reduce good air circulation in the boxes.

During winter, beekeepers at more northerly locations or higher elevations often close or reduce the screen opening beneath their colonies. This is thought to e useful to have the queen use more of the lower box for egg laying. Since clusters are in the top box in early spring and European bees are slower to expand downward more slowly this potential negative can be easily managed by reversal of brood boxes in the mid-spring.  It is not advisable with an open screen however to have wind blowing into and through the bottom of a winter colony. An air space beneath the colony, with screen bottom board left open, is not detrimental to colony wintering. The dead air space and, moderating soil temperatures may be helpful. Often this dead space beneath a screened bottom can be created with hive stand configuration.

Another advantage of a screen bottom board is that it provides for a convenient garbage pit to remove debris and fallen mites from a colony. The original Langstroth hive had such a feature but it was discontinued when the hive construction was simplified. They were thought to promote wax moth with the design Langstroth used.

The greatest benefit of a SBB is as a mite monitoring tool.  It is a key element in knowing HOW MANY mites are present since we know that most likely mites are already in the colony, There are some SBB that make this monitoring, getting our mite number assessment, easier than others. SBB with mite monitoring boards are the most useful. You can make your own or purchase such boards. Designs that allow you to insert the monitoring  board with minimal disturbance are best. However you can make your own and use petroleum jelly to trap fallen mites and a wide putty knife to clean it for reuse for very little expense.

Reading a mite monitoring board beneath a colony can be difficult. Mites are tiny and hard to see (use of pow-power magnifier and strong light can help focus the board assessment. Leaving a monitoring board underneath a colony for a single day or 2-3 at most will help reduce debris drop. If bees are cleaning out old pollen, are uncapping brood or honey cells or are heavily bringing in nectar or building new comb can result in higher levels of debris. Ants may enter and feed on the mites. seeds from grasses or nearby plants that blow into the hive and land on the screen board can greatly confuse the counting.

Screen Bottoms may offer some improvement for some beekeepers, particularly where winter confinement period is long and when mite populations are lower. In is not clear if this improvement is due to mites alone or to the other effects a screen vs closed bottom may have on colony survivability (see below). As regards varroa mites they should be considered a tool that may reduce winter losses when used in combination with other mite control treatments and tools.

May 2018 Dewey M. Caron

View PDF of this report here

Dead Colony Forensics by Dewey M. Caron

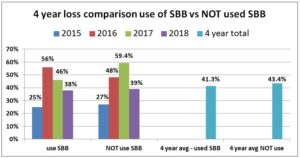
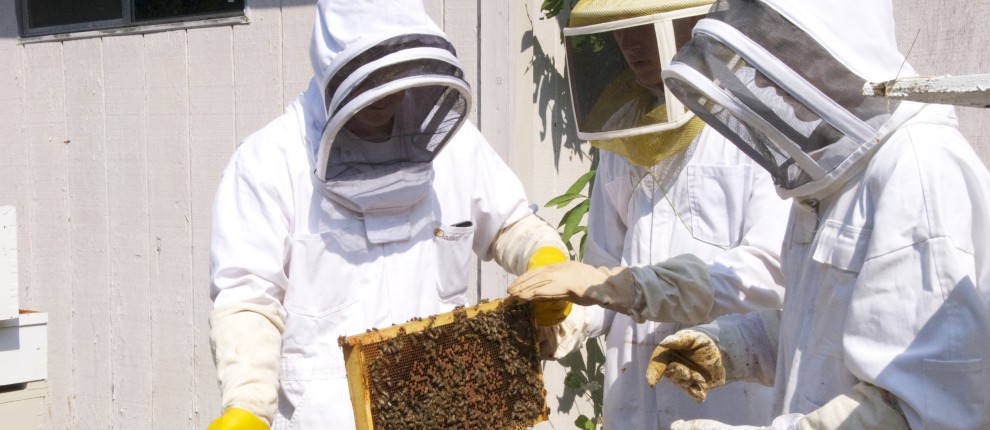
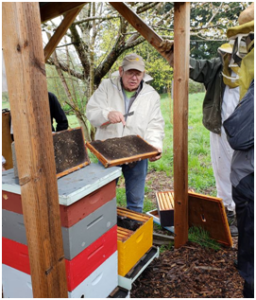
About a dozen brave individuals gathered at the Zenger apiary colonies Sunday April 15th, during a steady Oregon liquid “sunshine” rain for dead colony forensics with Dewey.  Photo right by Mandy Shaw.

Temperature was low 50’s, with only a couple foraging bees venturing forth from 4 of 8 colonies. We hefted boxes and did autopsy on two dead-outs.

Bees die overwinter for a number of reasons. By doing a dead colony autopsy we seek to determine what might have been the likely reason for non-survivorship.  Understanding the why might help us avoid a repeat this next winter.

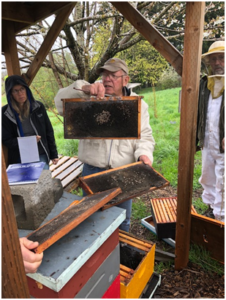
The first dead-out we looked at (photo above) proved to be a tough diagnosis.

The colony was a mid-May nuc donation from Beetanical apiaries of Lane Co. Hive had a standard and a shallow. The shallow frames were quite full (>3/4ths of cells) with capped honey. The shallow was lifted off and placed on upside-down cover.  There were dead brood remains on three frames of the lower standard box plus a small (<2000) number of dead adult bees on the screen bottom board and outside the entrance. Two adjacent frames had widely scattered capped brood cells extending in an oval  covering over  1/3 of the middle of the frames; there was a fist-sized patch of compact capped brood but it was not contiguous with the scattered brood of the other two frames. There was no evidence of a dead cluster but a considerable number of cells of stored pollen on 5 frames. Ample mold was evident in pollen cells and as a powdery grayish mold on surface of cells. Colony was sampled for mites with a sugar roll in September and had only 2 mites (<1%).  It was NOT treated for mites as it was a non-treatment control. Colony was alive in a mid-October inspection.

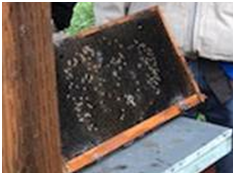
Photo of the three frames with brood shows the frame with a patch of compact brood (held  in my right hand) and two frames with very scattered brood (one in my left hand and the third on top of adjacent hive; this frame is shown isolated in photo right). Full super on ground.   Photos by Deb Caron.

So what can we diagnose? Lots of honey and pollen stores so we can likely rules out starvation. Small number of dead bee bodies suggests a small colony but if we would believe death from a too-small population of adults, there should have been evidence of a cluster with bees within cells and dead bee remains on the frame(s).  There wasn’t.

Thus our best guess is a colony that had a BEE PMS condition. The scattered brood remains on both sides of the two frames suggests this –a spotty (snot) brood situation MIGHT have been diagnosed in the October examination, but this requires a close examination of the brood; we might have noticed evidence to too few adult bees to cover the brood – both are subtle clues. The fist-sized brood area,  one frame over from the other two frames with scattered brood, might have been bees trying to escape the high mite numbers and their unhealthy brood of the 2 frames with scattered cells. Adult bees were likely dying prematurely and abandoning their (unhealthy) hive, thus the reason we saw only a smallish number of adult dead bees. The colony likely failed to rear sufficient fat, fall bees. The colony probably died within a month after the last October inspection, probably from a virus epidemic related to the mite infestation. NOTE: The September mite sample is misleading/confusing (we would expect it to have been higher); if an additional sample was taken it would perhaps have been higher?

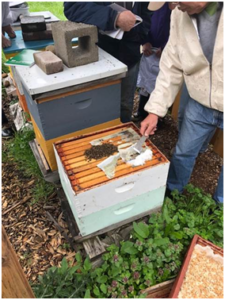
The second dead-out was a more standard necropsy. Hive was a spring split,that struggled all season. It had 2 shallows. Colony had a 19 mite count (6%+) in September and was treated with 2 formic pads between the two boxes. It was alive in March (this spring) but noted as small. It was fed dry sugar on paper (some still remaining) and provided with a frame of sugar candy.

Opening the top and removing moisture trap, (all Zenger hives had moisture quilt traps at top) showed a dead cluster of adult bees on 3 frames in top box at top of the box extending down about ½ way on the 3 frames (see photos; in photo right, hive tool is showing the remaining dry sugar on paper – quilt trap with wood shaving lower right). The adult bees were black and showed excessive moisture; there were many maggots (scavenger fly) feeding on the dead bees. There was capped brood in compact pattern within the cluster. Dead adult population was small (perhaps 8-10,000 bees). There was NO capped honey in any of the frames of either box. Lower box was empty. There were some dead bees on solid bottom board. There was little mold.

So what was diagnosis? The dead cluster is characteristic of a colony that overwintered the tough months (Dec-Feb) and moisture of adult bees, maggots and little mold suggests recent death. The compact brood shows the colony was starting to expand in the spring (flight was noted in March). Although dry sugar (as candy and crystal sugar) was given as emergency feed (hefting would have revealed lack of enough stores), it turned out to not be enough — colony likely starved. Bee cluster too small to generate enough heat to make slurry out of dry sugar or candy so bees couldn’t use it. Photo below shows one of three frames. We see “bee butts” under the dead cluster and compact capped brood.  Photo by Deb Caron.

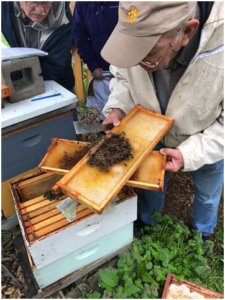
All frames, except one with high number of drone cells, could be reused for anew colony installation (package, swarm, split). Brush off dead cluster and from bottom board. If inclined wash mold with bleach or vinegar solution.

Living Close to the Edge

February in the Pacific Northwest Colony by Dewey M. Caron

February is a “pivotal” month for PNW bees. Queens have started laying eggs, especially those less than a year old. Our generally warmer winter weather in January, has enabled the workers of colonies with larger populations to expand the cluster size, opening up more cells for queen egg laying than might be considered “normal”.  This defines February as pivotal because colonies are often living “close to the edge”.

There is an adult age imbalance with more older than younger bees because the Fat bees reared in the fall are now senior citizens.  As the weather permits flight, these aging bees use body resources quickly. Fresh pollen to the February hive is highly stimulatory and important to rear critical replacements for dying adults. Unfortunately such expansion, along with the aging bees and clusters in the top brood box, mean less hive flexibility to quickly adjust to changing weather. Colonies less frugal with adult and stored food resources lead to the possibility of failure to survive in the coming two months. Underpopulated colonies, trying to keep expanded brood nests warm, can be lost in a cold, wet weather spell.

Our PNW Loss/Survivorship Survey is also at a “pivotal” junction. This fifth year of data will enable an official analysis of trends and correlations of losses to weather variation. Won’t you join us this year and share your overwintering loss/successes and answer a few questions about your overwintering and mite management? The PNW HONEY BEE SURVEY included over 350 respondents last year. It is simple to fill out. It is available online at pnwhoneybeesurvey.com/survey. We have the website open and ready for your survey responses in April. If you have been looking at your colonies and want to make notes to make filling out the April survey a breeze download the PDF note sheet at  pnwhoneybeesurvey.com/notesheet/.


Download this post as a PDF here

Dewey’s articles – Screen Bottom Boards


Screen Bottom Boards


Dewey’s articles – Report of Losses of honey bee colonies 2014-15

Report of Losses of honey bee colonies 2014-15

Dewey’s articles – Varroa mite control what works

Varroa mite control what works