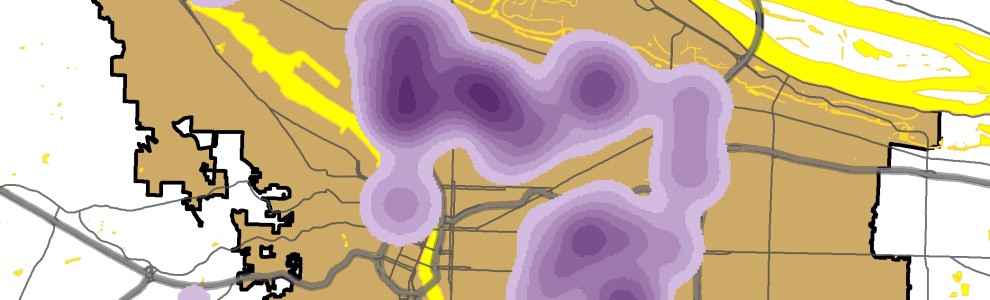
** Looking for a report in your specific region? Refer to the Individual Club Reports page.
** Scroll down to see the Washington Backyard Beekeepers Winter Bee Loss Report, 2025-26 or click here to view Washington as PDF.
Winter Bee Losses of Oregon Backyard Beekeepers for 2025-2026
by Dewey M. Caron
Click here to view a PDF of Oregon report.
Overwintering losses of small-scale Oregon backyard beekeepers remained low this season, 1.1 percentage points below the previous winter of Oregon hobbyist/backyard beekeeper surveys. – www.pnwhoneybeesurvey.com. Herein we discuss the data provided by 422 Oregon beekeepers, an increase of 170 from the previous year and 147 above the 10-year average response rate of 275 (range171-416) respondents. Overall loss rate was 24.4%. Results of the 226 Washington respondents completing surveys (more than 100 above the average response rate of the last 6 years of 120) are included in a separate loss report. The Washington average loss was 28.8%, 5.2 percentage points below loss rate last year. It was a record year for returns. Thank you.
State/Club Losses
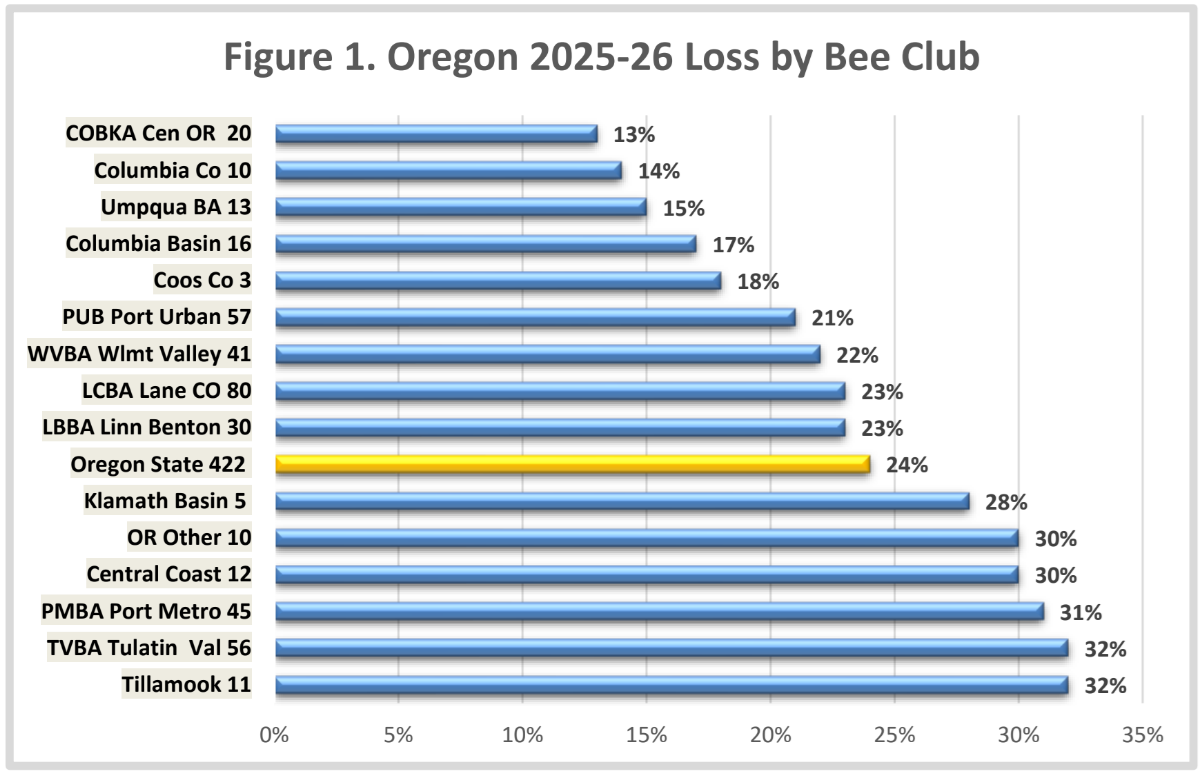
The Bee Club results of 15 local Oregon associations are shown in Figure 1 above. Individual colony numbers ranged from 1 to 45 colonies in Oregon (average 5.9 colonies, 0.2 percent higher than last year; medium number = 4 colonies, same as last year). The number of respondent individuals are listed following association name on Y axis. The bar length on x axis is the average club loss percentage for the year. Bars to left of 24% are losses below the statewide average while those above 24% had heavier losses.
Overwinter losses of members of the 15 clubs varied from a low of 12.8 for SOBA (16 respondents) to 32% for Tillamook (11 respondents). There were 10 respondents, two from coast and remainder in eastern Oregon, which had a 29.5% loss level. The 2.5X range (13 to 32%) loss of the fifteen clubs is one-half the range last year. Approximately 80% of respondents are along the I-5 corridor between California and Washington.
2025-2026 Overwinter Losses by Hive Type
The loss statistic was developed by asking number of fall colonies and surviving number in the spring by hive type. Respondents had 2485 fall hives (the highest number of past 10 survey years) of which 1879 survived to spring (606 lost), equating to a 24.4% loss (75.6% survival rate). This was a 1.1 percentage point improved survival compared to the previous winter loss rate. It was lower than the 16-year average loss rate of 36% by 12.4 percentage points.
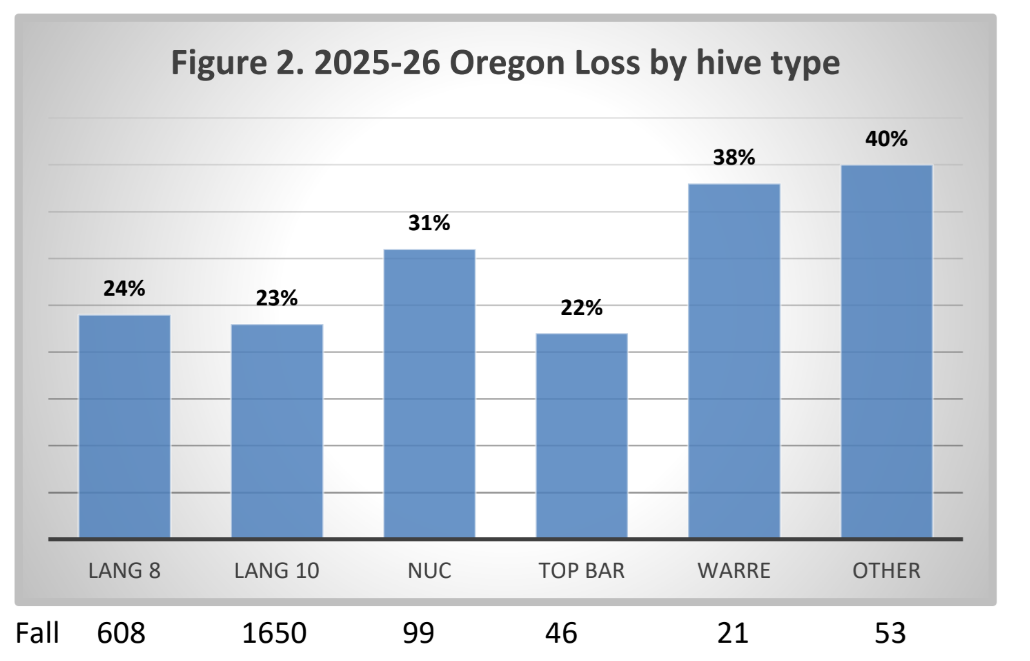
There were 608 fall 8-frame hives (loss rate 24%), 1650 10-frame Langstroth hives (loss rate 23.3%) , 99 nucs (loss rate 31.3%) and for “other” hive types 16 individuals keeping 20 long hives (loss rate 35%), 10 individuals with 11 Layens hives (loss rate 36.5%) and a single individual had a Ukrainian hive (it survived) . Among non-traditional hive types were 32 individuals with 46-top bar hives (22% loss), 13 individuals keeping 21 Warré hives (31.3% loss) and 22 “Other” hive types not identified with 45.5% loss rate – some could have been movable frame hives.
The loss rates of Langstroth 8 and 10 frame hives over the past 10 years have averaged 34.3% for 8-frame Langstroth hives and 38.7% loss for 10-frame hives respectively. This season there was only 0.7 percentage point difference, with 10 frame hives with slightly lower loss level. Nuc losses are typically higher than losses of 8 or 10-frame Langstroth hives as occurred this year. The Nuc 10-year average loss is 41.7%. This year’s Top Bar hive loss of ten colonies (22%) is below the 10-year average top bar hive loss of 46%. The 2026 Warré hive loss rate of 33 % is below the 10-year average of 38.6%.
2025-2026 Loses Based on Hive Origination
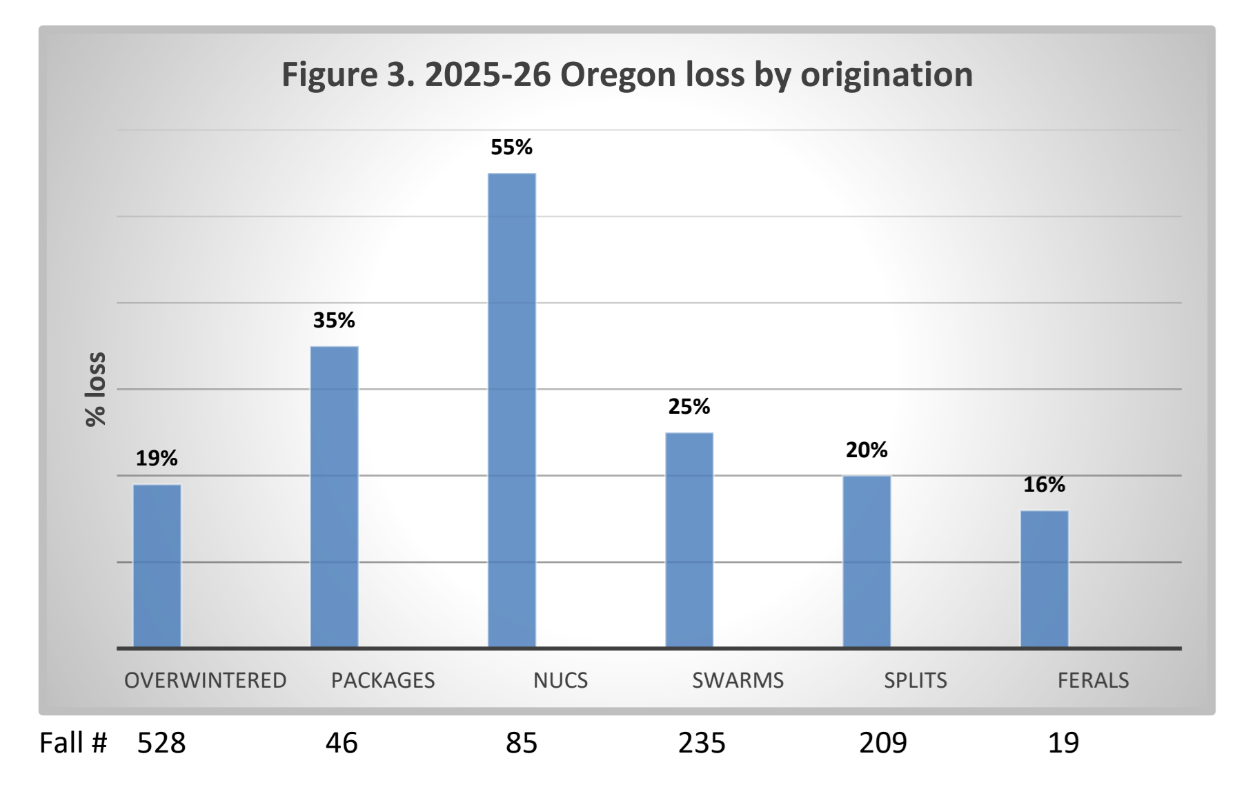
The survey asked respondents to characterize their loss by hive origination. This year respondents could FAST TRACK and 65% of respondents did not respond to this survey question. The results of respondents who did respond are graphically presented below. Overwintered colonies obviously had the best survival (19%) as is normally the case; it was 10.3 percentage points below the 29.3% average overwinter loss average for the past 8 years, 138 individual respondents. Packages also had excellent survival, 12% loss with 30 respondents. Nuc losses of 37% were below the 8-year average of 50.7% C. Swarms and splits had good survival (25% and 20% loss rates respectively, with 98 and 65 respondents). Only 19 feral colonies were reported by 11 individuals and they had 16% loss.
2025 -26 Individual Hive Losses
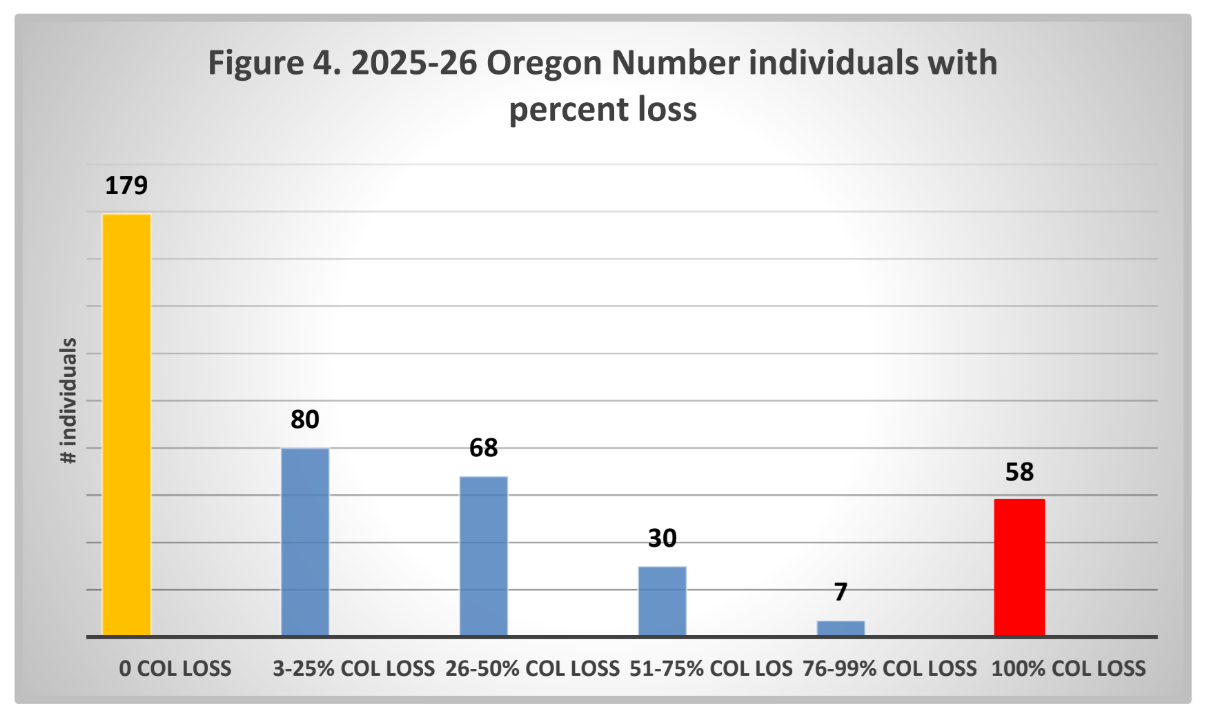
Forty and a half percent (179 individuals) of Oregon respondents had NO LOSS overwinter (total of 671 colonies, range 1 to 18 colonies), the same percentage compared to last year. Thirteen percent (58 individuals – 133 colonies, range 1-6 colonies) lost 100% of fall colonies. Figure 4 below shows loss by individuals relative to percent loss. The loss of a single colony (by 96 individuals) represents 35.5% of total individuals reporting loss. Six individuals (2%) lost ten or more colonies. The highest loss by a single beekeeper was 16 colonies. Numbers shown in Figure 4. Loss numbers are reflective of the fact that the median number of bee colonies of backyarders was four colonies.
Individuals with 1, 2 or 3 colonies, 190 individuals, lost 130 colonies = 21.5% of total 606 colony loss in 2025-26 winter period. The 119 individuals with 4 to 6 colonies, 574 total colonies, lost 29.5% of total colonies. The 34 individuals who lost 7-9 colonies lost 24.5% of total yearly loss. Those with 10-19 colonies (45 individuals – 619 fall colonies) lost 20% and the 16 individuals with 20+ colonies lost 16%. This relationship of individuals with increasing colony numbers having, on average, lower losses has been constant every survey year.
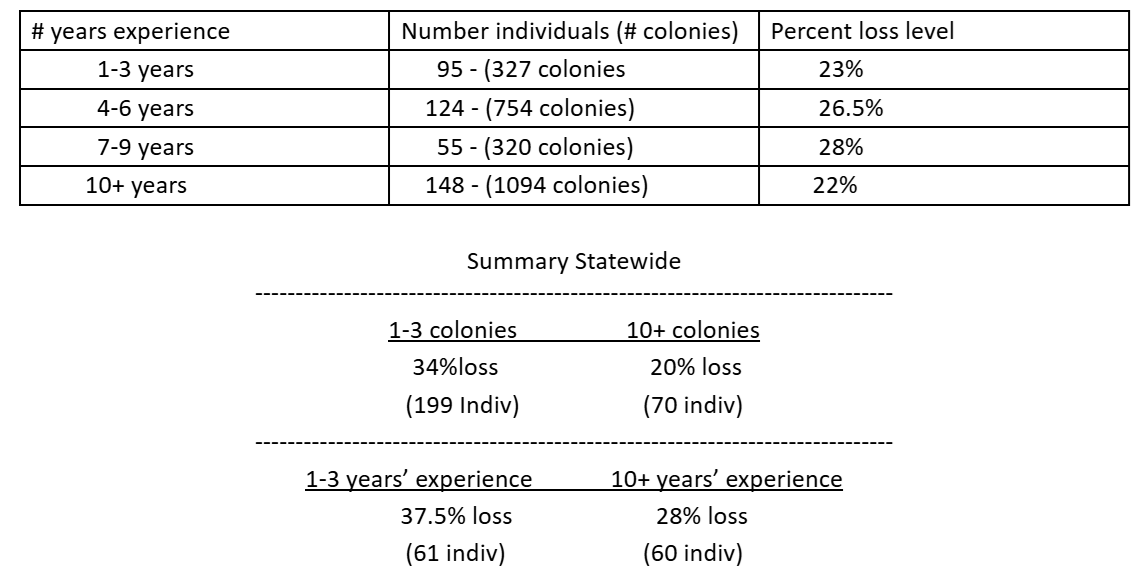
Survey respondents are primarily small colony number beekeepers but years experience varied widely. The 190 of the 442 survey respondents (43%) that had 1, 2 or 3 colonies (16% of total colonies) had an average of 7.7 years of experience (range 1-48 years). The 119 Individuals with 4-6 colonies had 9.1 years experience (range 1-40 years). There were 34 individuals with 7 to 9 colonies – they had 11 years average experience (range 1-60 years) while the 61 individuals with 10+ fall colonies had 11.7 years experience (range 1-50 years).

By years of experience, the 95 individuals who had 1 to 3 years bee experience (21.5% of total respondents) had 23% colony loss level, the 124 individuals with 4-6 years experience (28% of survey takers) had a 26.5% loss level, the 55 individuals with 7-9 years expereince, 17.5% of total respondent number, had 23% loss level. There were 148 individuals with 10 or more years experience (33.5% of total respondents) lost 22% of their colonies. Lowest was the 18 individuals with 30-60 years experience (186 total colonies) who had a 14.5% loss level. There is no correlation – losses did not decrease as years of experience increased.
Overwinter Losses the Past 17 Seasons
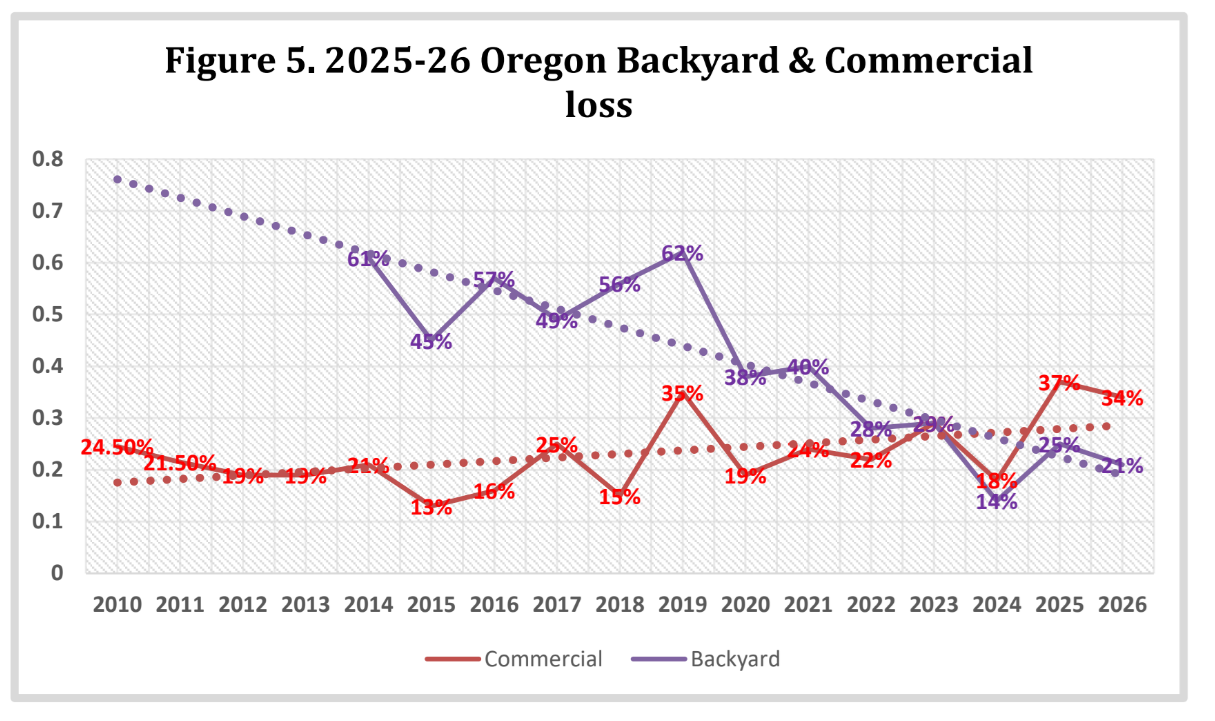
Comparison of the annual losses of backyarders with commercials is shown in Figure 5. A relatively small number of commercial beekeepers (individuals with 50 or more colonies) complete the electronic survey. Therefore, the number of commercial respondents (4 commercial and 5 sideliners) is preliminary as of May 1; reported losses on only 9082 colonies (which is 12% of NASS estimated colony number in Oregon, 76,000 colonies). Their preliminary loss rate is 33.5%. The national survey of Auburn and OSU will have a better estimate, and the commercial loss rate will be determined with this result.
Average backyard losses =36.3% loss and 15-year commercial/semi-commercial loss = 21.4%. The BeeInformed Partnership (BIP) average (14 years) =25.4%; in 2024 the national survey was discontinued by BIP. Since then, a consortium of Apiary Inspectors of America, Auburn University and Oregon State University have conducted a national loss survey. The 2024-25 winter loss was 37.7%.
Some Other Numbers
Fifty-four individuals (12%), same percentage as last year, had more than a single apiary location. The loss level at 2nd apiary was same in 20 locations, had improved losses in 21 instances and in 13 survival was poorer. Six individuals had a 3rd apiary site with 2 reporting the same survival, 3 better and 1 poorer. Fourteen of these 2nd sites had one colony and 13 more had 2 colonies at 2nd apiary site. The colony average at 2nd apiary was 7.3 colonies (highest number was 20) with the medium number of 2. Sixteen individuals had a third apiary and 4 had yet another apiary. Average colony number at 3rd apiary site was 3.7 colonies (highest number 10) with medium of 3.5 colonies.
Three hundred twenty-three individuals (76.5%) said they had a mentor available as they were learning beekeeping. This was 1.2 % less than last year. Thirty-one percent of individuals, same as last year, had more than one hive type. And, finally, 30, nearly 7 % of respondents – last year it was 12 individuals (5%) – moved their bees. Distance moved included a few feet, several yards or miles away (greatest distance was 21.5 miles for a “location change”). Two moves were for sale/gifting of hives, one was due to owner move, 3 were for pollination, at least 7 were to seek a better honey site, at least 4 were swarm related, 1 was for better winter site, and 3 involved new locations of beekeeper.
Perceived Colony Death Reason and Acceptable Level
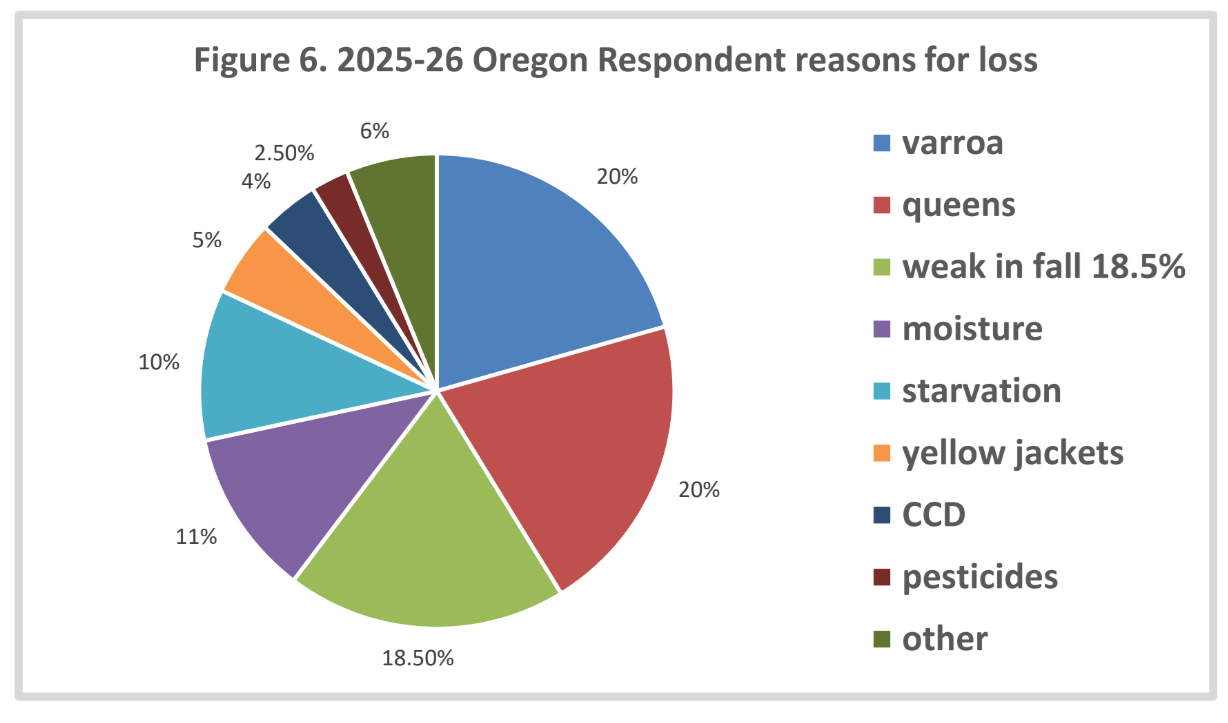
The survey asked individuals that had colony loss (179 individuals listed no loss) to estimate what the reason might have been for their loss (multiple responses were permitted). Fifty individuals listed don’t know. There were 400 total listings (excepting the don’t know response), almost 2 per individual (1.9/individual). Varroa (80 individuals), Queen issues (79 individuals – both 20% of reason listed) plus weak in the fall (74 individuals – 18.5% of reasons listed) were most common. Moisture (44 individuals -11%) and starvation (39 individuals – 10%) were next, followed by yellow jackets (20 individuals), CCD (17 responses), pesticides (10 selections) and poor wintering (11 individuals). Among 25 other suggested reasons for winter loss were swarming/absconding/bees left (11 individuals), mite treatment (3 individuals), and bears + late fall hive (2 individuals each). Single listing of nosema, mice, wax moth, skunks, robbing, and lack of beekeeper experience. See Figure 6 graph below.
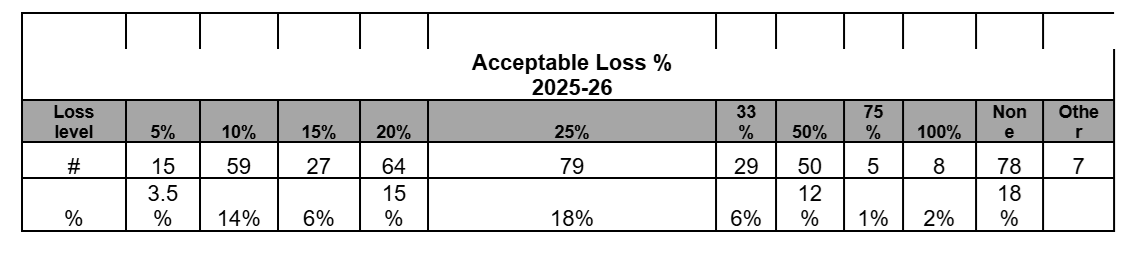
Acceptable loss: Survey respondents were asked the reason for loss. Seventy-eight respondents (18%) indicated zero (no loss). Twenty percent was the medium and most common choice (outside of zero) choice, as has been the case for several years. Fifteen percent said 50% or greater was an acceptable loss level; five said 75% and 8 said 100% loss levels acceptable. See Table below.
Why do colonies die?
There is no easy way to verify reason(s) for colony loss. Colonies in the same apiary may die for several reasons. Examination of dead colonies is at best confusing and, although some options may be ruled out, we are often left with two or more possible reasons for losses. A dead colony necropsy can be of use. Opinions vary as to what might be an acceptable loss level. We are dealing with living animals which are constantly exposed to many different challenges, both in the natural environment and the beekeeper’s apiary. Individual acceptable choices varied from zero to 100%, with a medium of 20%. Note that some “reasons” are not likely to be the actual reason for loss but secondary factors, such as mice, skunks and wax moths, except for unusual circumstances.
The major factor in colony loss is thought to be mites and their enhancement of viruses especially DWV (deformed wing virus), VDV (Varroa destructor Virus – also termed DWV B) and Israeli and chronic paralysis viruses. But we do not have a test for these viruses. It was interesting that weak in the fall and queen problems were also the most frequently indicated reasons along with varroa mites as leading reasons for loss.
Declining nutritional adequacy/forage and diseases, especially at certain apiary sites, are additional factors that result in poor bee health. Yellow jacket predation is a constant danger to weaker fall colonies. Management, especially learning proper bee care in the first years of beekeeping, remains a factor in losses. What effects our changing environment such as global warming, contrails, electromagnetic forces (including human disruption of them), human alteration to the bee’s natural environment and other factors play in colony losses are not at all clear.
There is no simple answer to explain the levels of current losses nor is it possible to demonstrate that they are necessarily excessive for all the issues our honey bees face in the environment. It was encouraging to see from survey responses that overall losses this past year, 24.4%, were still at a low level. More attention to colony strength and the possibility to mitigate colony weakness in the fall may help reduce some of the losses. Effectively controlling varroa mites will definitely help reduce losses as fewer mites will result in less virus damage.
Colony Managements
The survey asked for information about management practiced by respondents. This year individuals could FAST TRACK through the electronic survey and not answer questions on management. The survey inquired about feeding practices, wintering preparations, sanitation measures utilized, screen bottom board usage, and mite monitoring. Fewer individuals (114) skipped both non-chemical and chemical mite control techniques; 158 opted out of answering the section on queens. Respondents could select multiple options and there was always a none and other selection possible.
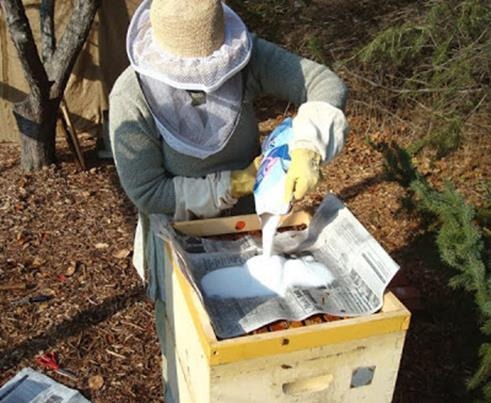
FEEDING: Oregon survey respondents checked 708 feeding options = 2.8/individual, (0.6 less than last year). Forty-five individuals (17.5%), other than the 17 who indicated no feeding, selected a single choice and had 18.5% loss. Fourteen used sugar syrup, 9 hard sugar, 9 fed frames of honey, 1 each liquid honey, fondant and Hive Alive. Seventy-one (28% of respondents) indicated 2 choices (24%, loss), 72 (the greatest number and medium) indicated 3 choices (they had 20.5% loss), 44 individuals (17.5%) had 4 choices with 21% loss, 18 (7%) had 5 choices (25 % loss), and 5 individuals (3%) had 6 and 2 had 7 choices and collectively they had a 21% loss. There was relatively little difference – doing more feeding managements did not measurably improve survival.
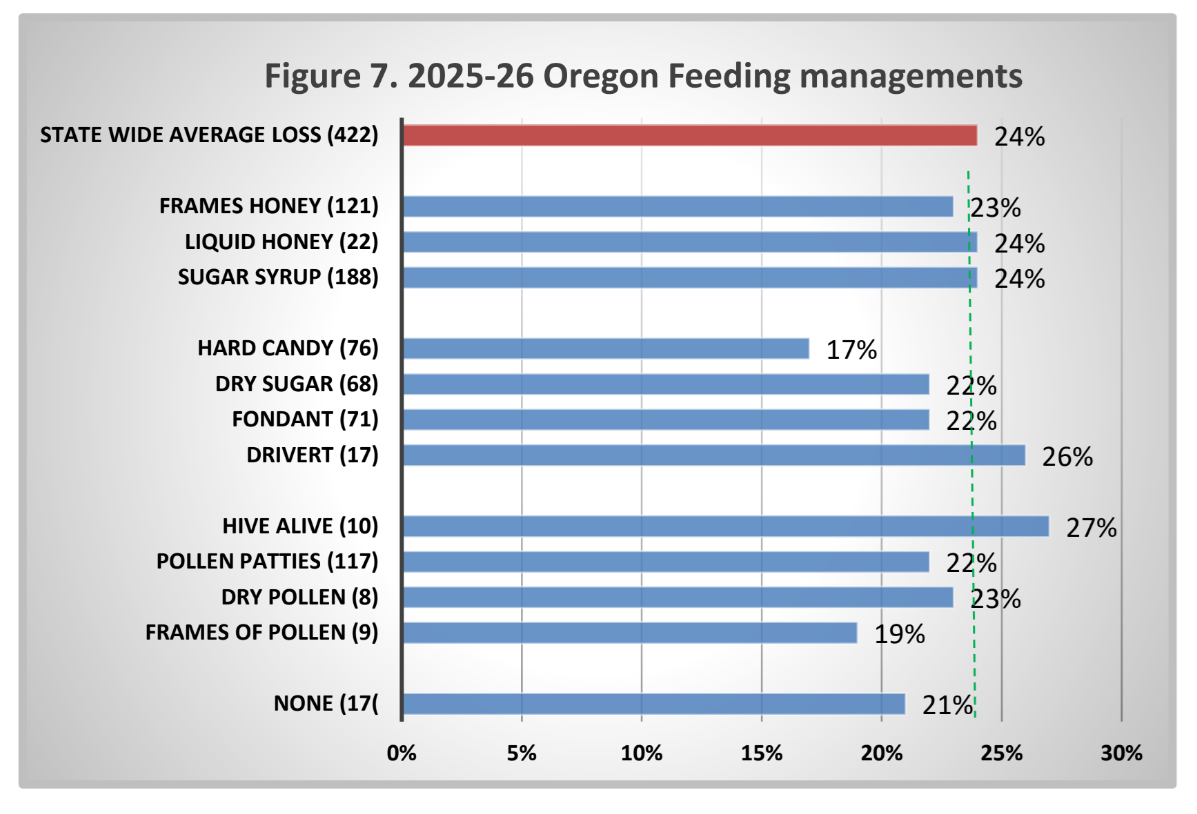
The managements with number of individuals making that selection are in ( ) in Figure 7; bar length indicates loss level of individuals doing this management. Those bar lengths to left of 24%, the average state survival, the green dashed marker, had better survival, while those to right had greater loss level.
Seventeen individuals (11 more than the previous year) said they did NO FEEDING. They had 55 fall colonies, lost only fifteen for a 27% loss, which was 3 percentage points higher loss compared to the average statewide colony loss. Feeding sugar syrup was the most common feeding option of respondents (188 individuals, 73% of respondents) who indicated feeding management. Their loss rate was 23.5%, slightly below the overall average. Interestingly, the 68 individuals who did not feed sugar syrup had only a 20% loss. I have no explanation for this difference.
Individuals feeding protein 125 individuals (49% of respondents) had an overall survival rate of 22.5%. Those feeding frames of pollen, only 9 individuals, had the best survival of all protein feeders at 19%. The individuals feeding dry pollen had a 22.5% loss – last year they had the best survival of the 3 methods of feeding protein. There were 129 instances of feeding non-liquid sugar. The best survival rates were the 78 candy feeders, only 17% loss; last year the candy feeders also had the best survival.
Summary: Statewide for the last 9 years, individuals who did no feeding had only a 3.2 percentage point higher loss (average 38.2%) i.e. poorer survival, compared to the average loss rate of 35%. This year, the 17 individuals doing NO FEEDING had 21% loss which is 3 percentage points better than average survival (24%). The average percent doing no feeding = 6.1% of individuals the past 9 years – this year it was 6.2% of responding individuals. Feeding is basic management – I do not know why individuals doing no feeding had better than the average survival.
Individuals statewide that fed sugar syrup had a 0.5 percentage point lower loss level average for the last 10 years; this year it was again the same – 0.5 percentage point better survival. Those feeding honey (as frames or liquid) had lower loss only during three of the past 10 years. This year loss level was the same as statewide average for those feeding liquid honey and 1.5 percentage points better survival for those 121 individuals who fed frames of honey.
Individuals feeding non–liquid sugar (in any form) had lower losses eight of past ten past winter seasons. Dry sugar feeders had slightly better or equal survival 9 of 10 past winters and this year, with 22% loss, did better as well; hard candy feeders had improved survival 9 of 10 past winters, including this past winter, with the best survival of all for dry sugar feeders at 17%. Only drivert feeders, 17 individuals, had poorer survival this year than statewide average.
For individuals feeding protein, the protein patty users have had better survival 7 of 10 years (this year losses were 0.5 percentage points better than average); dry pollen feeders had better survival in four of the past 10 years and this year had a 22.5% survival which was 1.5 percentage points better than average.
It is clear that feeding, while a beneficial management, does not, by itself, significantly improve overwintering success.
WINTERING PRACTICES: We received 663 responses (2.65/individual) about Oregon beekeeper wintering management practices (more than one option could be selected). Twenty-two individuals, (9%) of the respondents. indicated doing none of the several listed wintering practices; two years ago, 6% of individuals had an elevated 44% winter loss, more than double overall loss, but last year only a single colony of 35 in the fall died of individuals doing no winterizing – a 3% loss, 97 % survival rate. This year, of 146 colonies of the 22 individuals, loss was 26% – 5 percentage points above the average state loss. For those indicating some managements, 74 individuals (29.5%) did one single thing, (27% loss), 80 respondents (32%) made two choices (21% loss), the median choice, 73 individuals selected three of the winter managements (19% loss), 26 (10.5% of respondents) did 4 (26% loss), 15 did 5 (11% loss) and 4 did 5 and one 6 with 35% loss. Doing more did not ensure overwintering success.
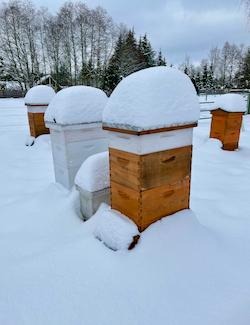
The most common wintering management selected, 126 individuals, 60% of responses, was venting the upper box (21% loss). Next most selected management was using an insulated top (103 individuals, 41% of respondents (they had a 19.5% survival level. Equalizing colonies in the fall had the lowest loss level of 15% (54 individuals) both this year and last year. Wrapping colonies (81 individuals) had slightly lower loss than sheltering colonies from wind/water (60 individuals, 22% loss). Figure 8 shows per cent of individual choices and bar length shows percent winter loss of each selection. Bars to left of 24% line means better survival than overall. Most managements helped reduce losses.
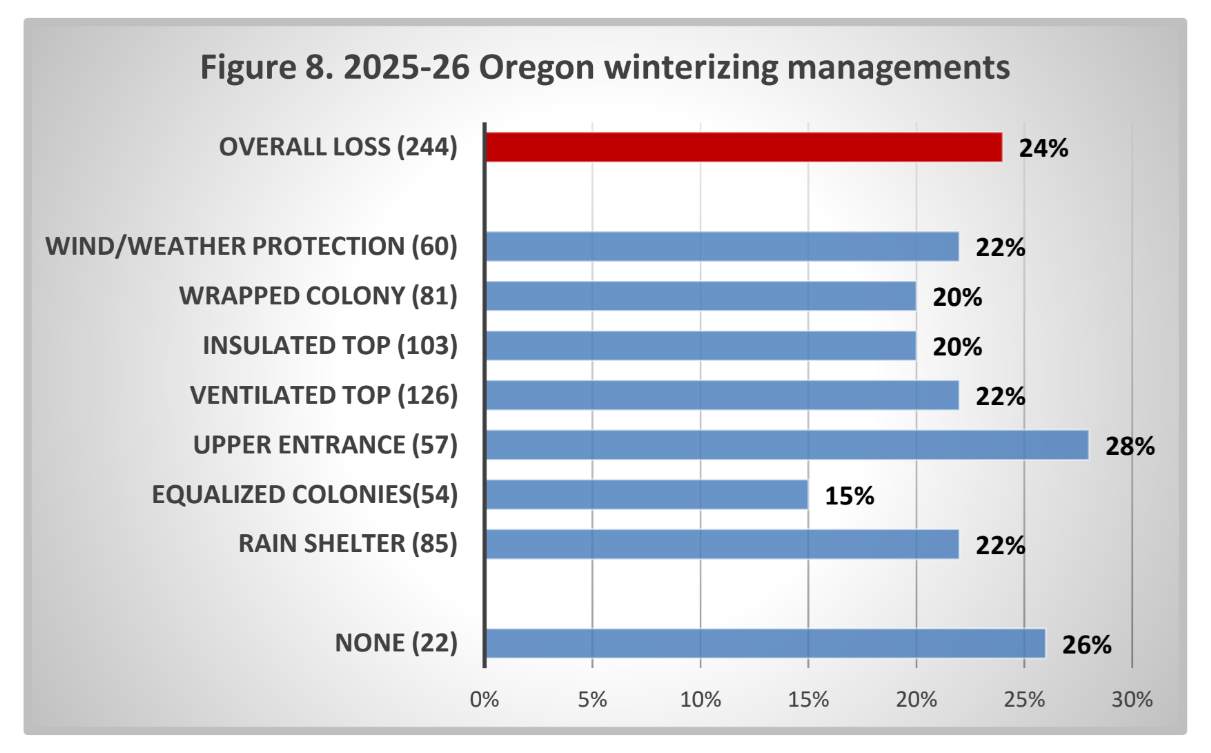
Summary: Over the past eight years individuals that did no winterizing practice (average 10% of individuals –this year the 22 individuals were 8% of respondents) but recall that 38% of total OR respondents did not respond to wintering management questions when they did FAST TRACK, averaged 6.5 percentage point poorer survival rate – this year it was a 4 percentage difference. The 22 individuals doing NO Winterizing lost 38 of 146 fall colonies.
The winterizing management that had the best survival was equalizing colonies (54 individuals, 15% loss), as it was last year. Use of an insulated top winter management has improved survival 7 of 8 years (8-year average a 6.3-percentage point improvement); this year it was 2nd most common winterizing management (103 individuals), and they had a 4-percentage point improvement in survival. Also, a 4-percentage point better survival was realized by the 81 individuals who wrapped colonies. Vivaldi/quilt box, wind/weather protection and a rain shelter all showed a two percent better survival. Like feeding, winterizing efforts, while useful for some individuals, is not by itself a means to significantly improve wintering success. Other measures included modifications to top of hives for additional insulation, closing bottom entrance or the screen bottom board and moving to a more favorable site.
SANITATION PRACTICES: It is critical that we practice some basic bee sanitation (some prefer use of term bee biosecurity) in our bee care to help ensure healthy bees. We received 510 responses for this survey question 2.3/individual, which was 1.2 percentage points greater than last year. Fifty individuals said they did not use any of the six offered alternatives; they had a loss rate of 21% compared to the overall rate of 24%. Over a five-year period before FAST TRACK those indicating doing nothing had a 37.9% percent loss rate, four percentage points higher than the average loss rate of 33.9% over the same time period. This year with 3.4% better survival and last year with a 3.5 percentage point better survival is a different relationship without the FAST TRACK respondents.
For the 224 respondents (minus the 50 respondents who selected none) 73 individuals (32.5 %) had 1 selection with 25.5% loss, 71 made 2 choices (the median number) with 20% loss level, 40 selected 3 managements (21% loss level), 28 had 4 (23.5% loss level), and 12 made 5 or 6 selections with 13.5% loss level, the lowest loss level for the sanitation selections.
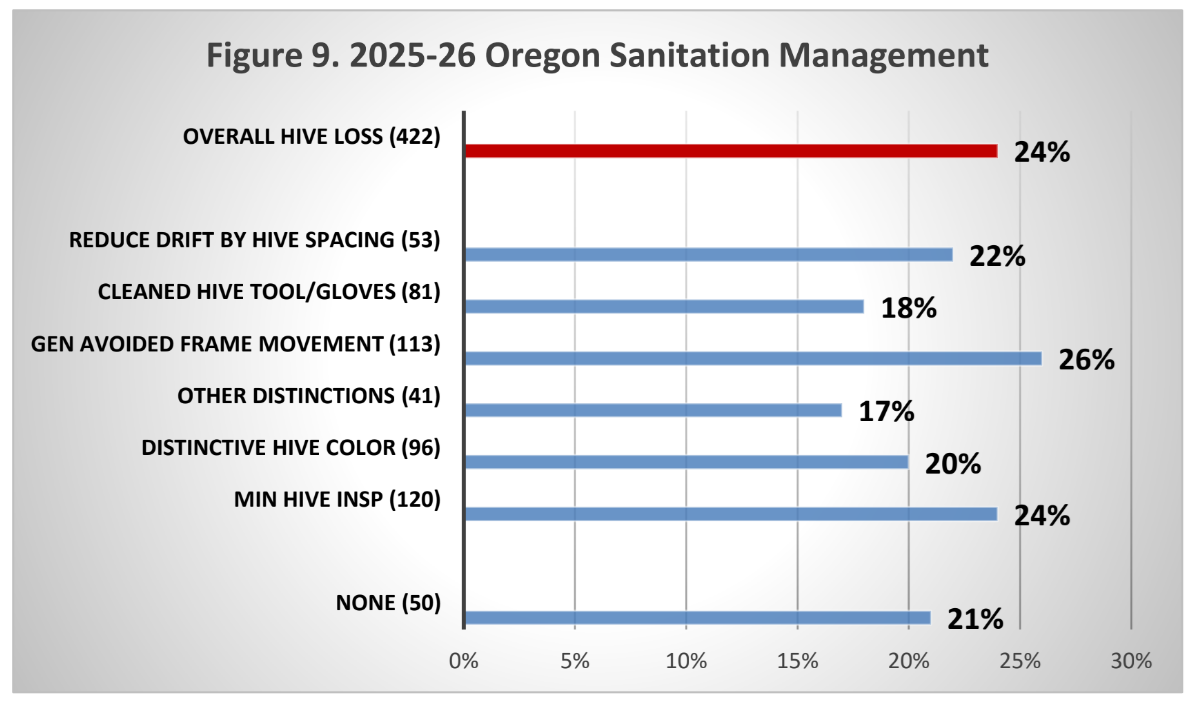
Minimal hive intervention (120 individuals) was the most common option selected, as it has been for the last 5 years. It could be argued that less intervention might mean reduced opportunity to compromise bee sanitation efforts of the bees themselves and that excessive inspections/ manipulations can potentially interfere with what the bees are doing to stay healthy. This option, however, has not improved winter survival; the loss rate for this group the past 8 years was 42%, 10.3 percentage points above the average 8-year loss rate. This year the 50 individuals had a 21% loss rate, 3 percentage points below the average. Cleaning hive tools and gloves and, particularly, measures to make colonies distinctive had the best survival but also the fewest participants. Other sanitation measures listed included using one hive tool for one hive, placing deadout frames in freezer before reusing and lowering colony number to fit the land carrying capacity.
The best management for several years was to paint hive bodies assorted colors (96 individuals with 20% loss rate) and doing other managements to avoid drifting (41 individuals, 16.5% loss rate). Reducing drifting has been a sanitation choice that has demonstrated better average survival the past eight years – 2.5 percentage point improvement this year. This year and last, generally avoiding moving frames had slightly poorer survival – 2 percentage points poorer this year. Overall, sanitation appears to be relatively minor toward improving survival.
SCREEN BOTTOM BOARDS (SBB)
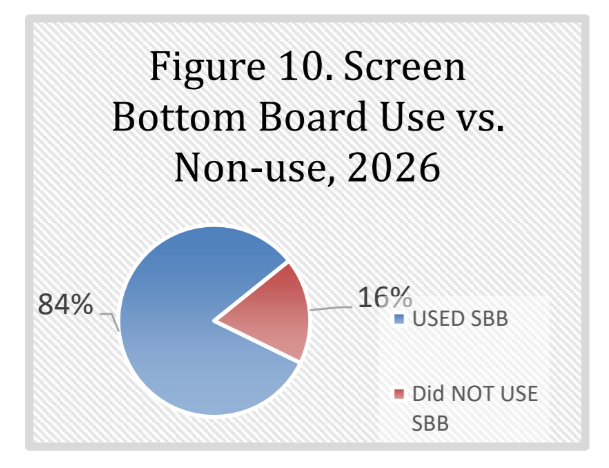
Although many beekeepers use SBB to control varroa, BIP and PNW surveys clearly point out they are not a highly effective varroa mite control tool. In this recent survey, statewide 35 of the 224 individuals responding (15.5%) said they did not use screen bottom boards – 25% said they used sometime. Average non-use for the last ten years is 16%, vs 84% use, on some or all colonies.
This past overwintering season, the 35 non-SBB users had winter losses of 50 colonies, a 19.5% loss. Examining the ten-year average of SBB use, loss level of the 84% using SBB on all or some of their colonies was 32.2% loss level whereas the 16% not using SBB had loss rate of 35.2%, a 3-percent point positive survival gain for those using SBB versus those not using them. This year those using screen bottom boards had a 22.5% winter loss versus those not using them having a 19.5 % loss.
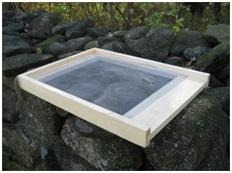
We asked if the SBB was left open (always response) or blocked during winter. This past season, 84.5%, 187 individuals, said they always or sometimes blocked SBB during winter. Statewide those who blocked always or sometimes had 1081 colonies in the fall and lost 207, a 19% loss rate. Those 37 who never blocked had a 32.5% winter loss, a 13.5-point percent difference; last year it was a 6-percent point difference. As in past years, there is an advantage in favor of closing the SBB over the winter period to improve survival.
Mite monitoring/Sampling and Control Management
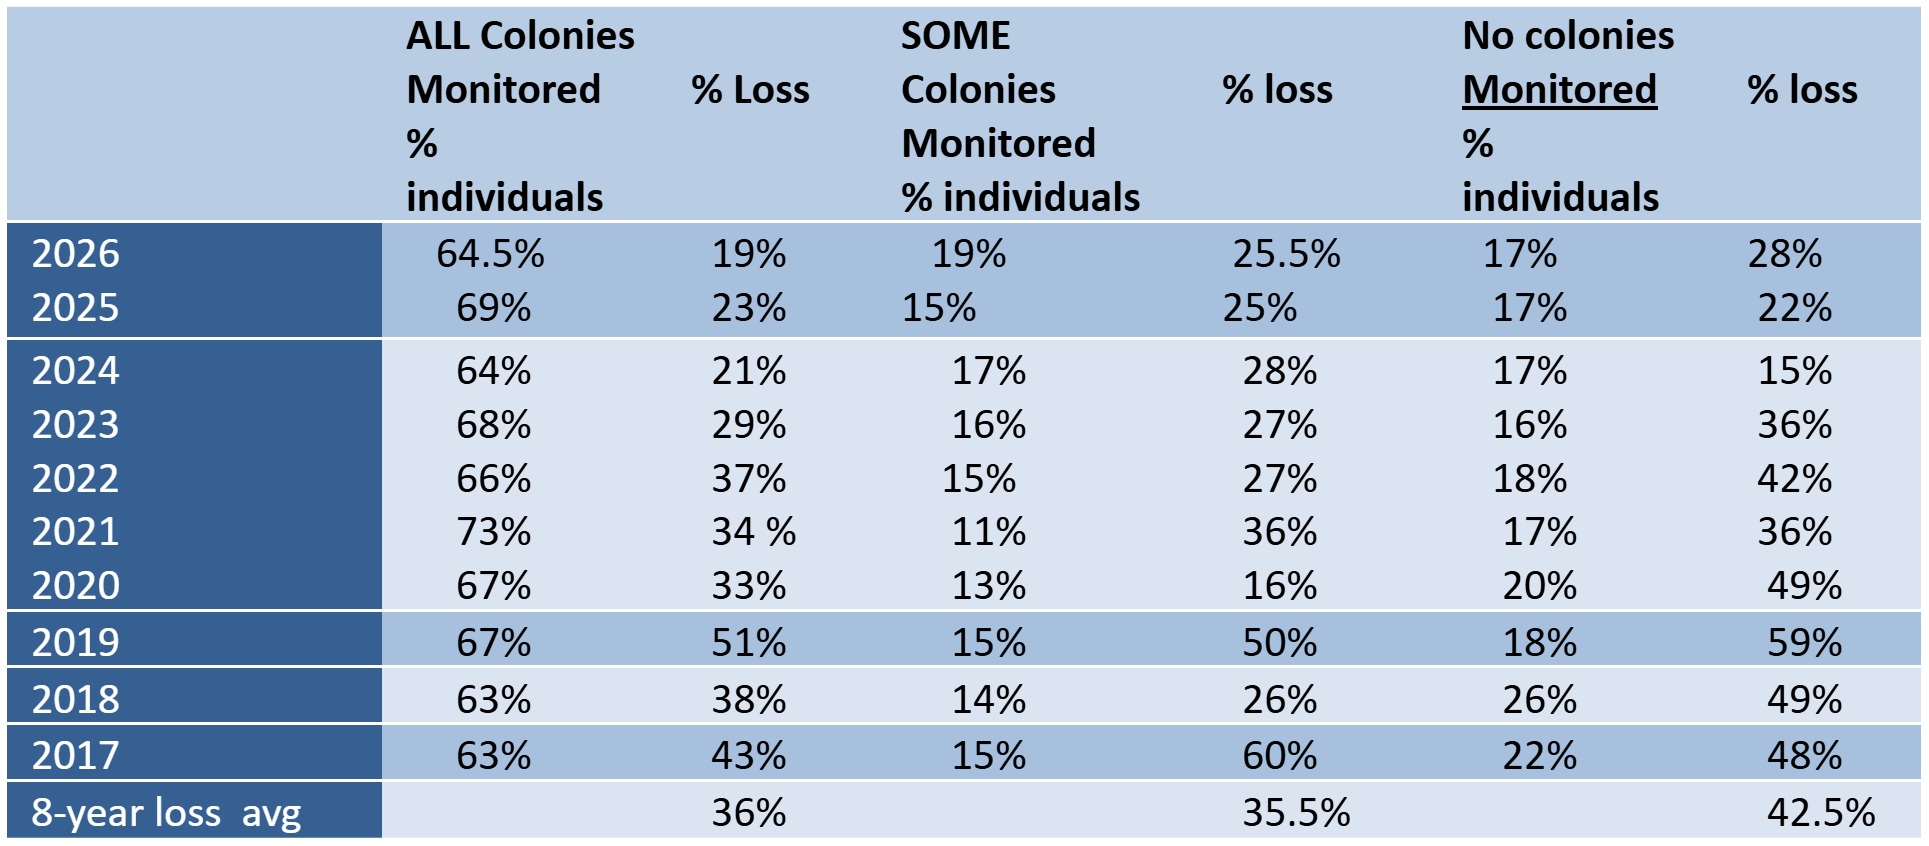
One hundred twenty-four respondents (64.5%), said they monitored all their hives. The losses of those individuals monitoring were 19%. Thirty-six individuals (17%) reported no monitoring; they had 28% loss. Thirty-two individuals reported monitoring some of their colonies; they had a 25.5% loss. Data for last 9 years in table below.
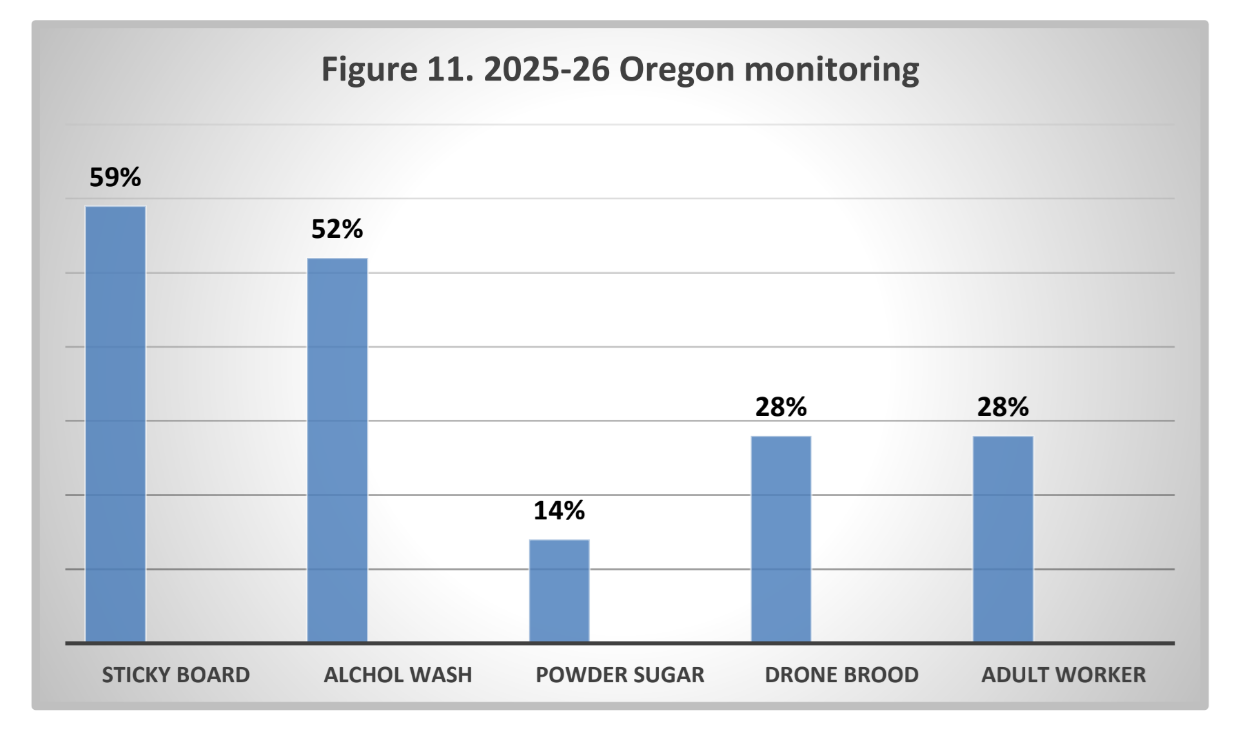
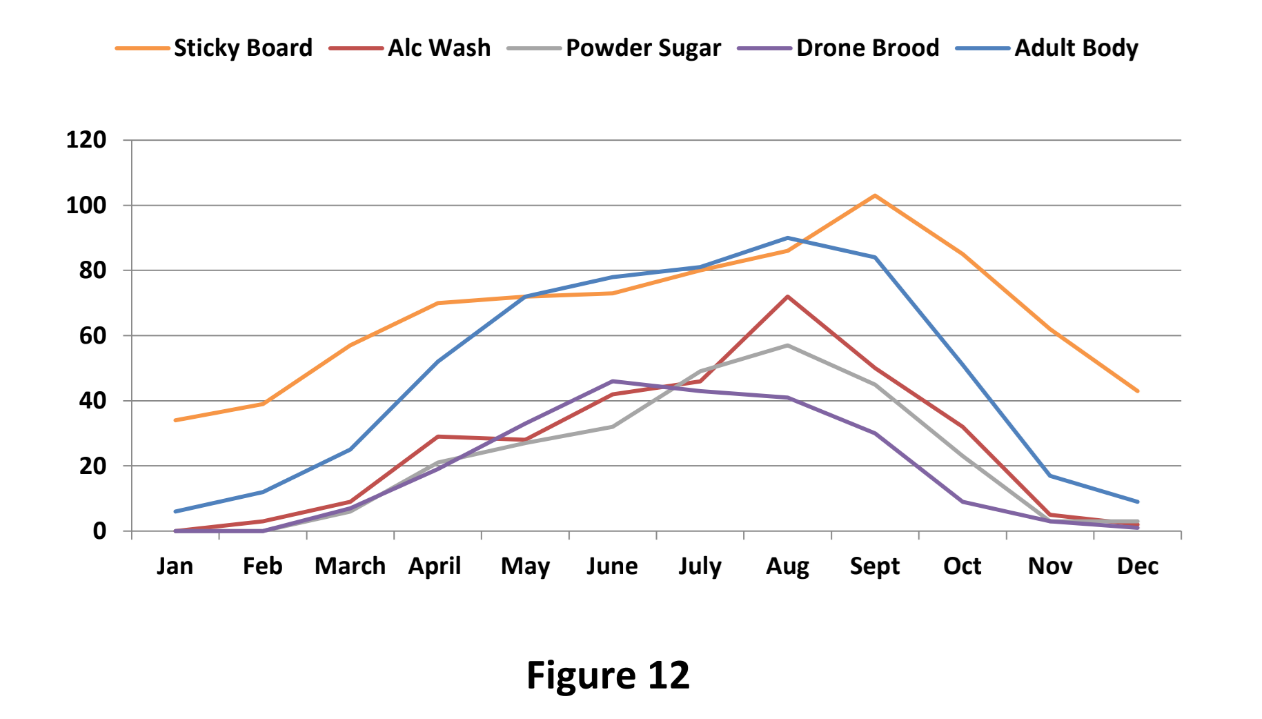
Individuals indicated use of 2 monitoring techniques on average. In total choices, in order of popularity of use, 95 individuals used sticky boards, 83 used alcohol wash, 36 used powdered sugar, 57 looked on adult bees for mites and 56 looked on drone brood for mites. In the past 5 years, the use of sticky boards has decreased, and alcohol washing has increased in use. This year sticky board percentage exceeded alcohol – the previous three years alcohol use monitoring was the major monitoring technique. Figure 11 below Illustrates percent using the five monitoring methods.
Whatever technique used, most sampling to monitor mites was done in July – September, as might be expected since mite numbers change most quickly during these months and sampling results can be used to key control decisions. Figure 12 illustrates, from a previous season, monthly sampling with five methods.
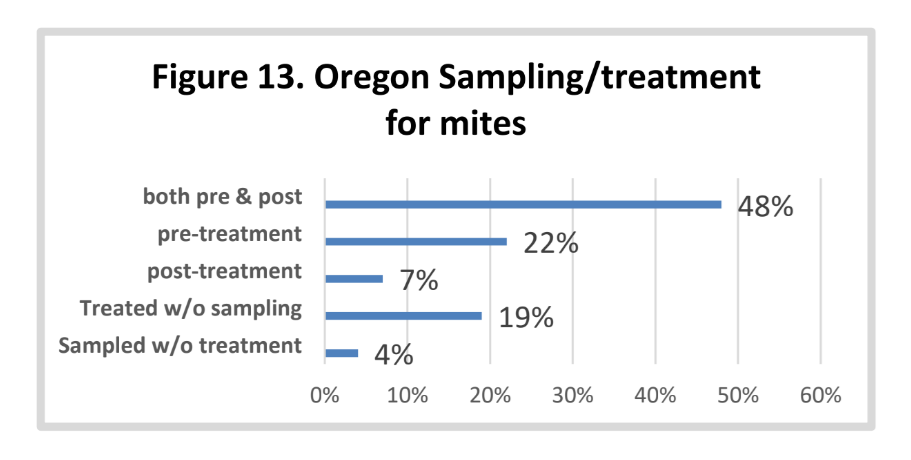
There were 144 responses to when sampling was conducted. The most common sampling of respondents is both pre- and post-treatment (48% average) followed by sampling pre-treatment (22%). It is important to know if the treatment works so post treatment should not be avoided. Treatment without sampling was 19%, an increase of six percentage points over the last two years. Figure 13.
It is important to KNOW mite numbers. Less effective mite monitoring methods include sticky (detritus) boards below the colony and powdered sugar. Often so much detritus drops onto a sticky board that counting the mites can be hard, especially for new beekeepers. Sticky boards used for a single day pre- and post-treatment can help confirm the effectiveness of a treatment, if numbers drop post treatment. Visual sampling is not accurate: most mites are not on the adult bees, but in the brood, especially when there is a lot of brood. Additionally, adult mites are NOT on the adult body where they can be observed (over 90% are on the lower abdomen, tucked within the overlapping bee sternites). Sampling for mites in drone brood needs to be refined as a predictive number; they can be used as an early warning of the numbers of mites reproducing in drone cells.
See Tools for Varroa Monitoring Guide www.honeybeehealthcoalition.org/varroa on the Honey Bee Health Coalition website. The Tools guide suggests mite level to use to base control decisions based on the adult bee sampling. A colony is holding its own against mites if the mite sample is below 2%. It is critical not to allow mite levels to exceed 2% during the fall months when bees are rearing the fat fall bees that will overwinter. It is also the most challenging time to select a control method (if one is deemed needed) as potential treatment harm may negatively impact the colony. We see more colonies suddenly disappear (abscond?) during the fall, which may be related to the treatment itself or bees suffering for mite transmission of viruses.
Mite Control Treatments
The survey asked about non-chemical mite treatments and about the use of chemicals for mite control. Twenty-seven percent of respondents did not respond to the varroa mite control questions (they lost 141 colonies of 464 fall hives- a 30.5 loss level)– 309 individuals did complete this part of the survey. Forty-eight individuals (15.5%) said they did not employ a non-chemical mite control. Those 48 individuals reported a 30.5% winter loss, six percentage points poorer survival than overall. Twenty-one individuals (7%) did not do a chemical mite control – they had a 45% loss level, a 20-point poorer survival. The individual options chosen for non-chemical control and chemical are discussed below.
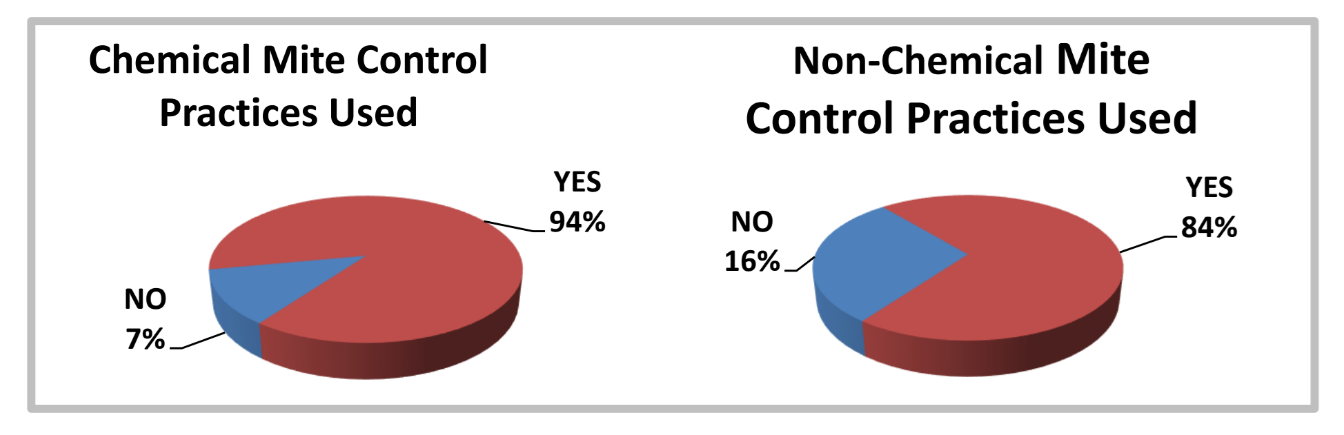
Non-Chemical Mite Control: Individuals selected 639 total treatments. 2.4/individual. Of nine non-chemical alternatives offered on the survey (+ other category,) 69 individuals (26.5% of respondents excluding the 48 individuals who selected none) used one method (and had a 26% loss level), 88 (33.5%) used two (24.5% loss), 48 used three (22% loss), 38 (14.5%) used 4 (17.5% loss), 13 (5%) used 5 (30% loss) and 5 individuals used 6 (loss level 12%). Clearly using more than one method/tool (with the unique exception of the 5% with 5 selections) improves success.
Two hundred-ten individuals (80% of total respondents – 6 percentage points higher than last year) listed use of screened bottom board. They had 25.5% loss, one percentage point higher than average. The next most common selection was distinctive colors (104 individuals= 40% of respondents); they had a 19% loss, 5 percentage points better than statewide average. The use of the remaining selections is shown in Figure 15; number of individuals in ( ), the bar length represents the average loss level of those individuals using each method. Those left of green dashed line had improved survival.
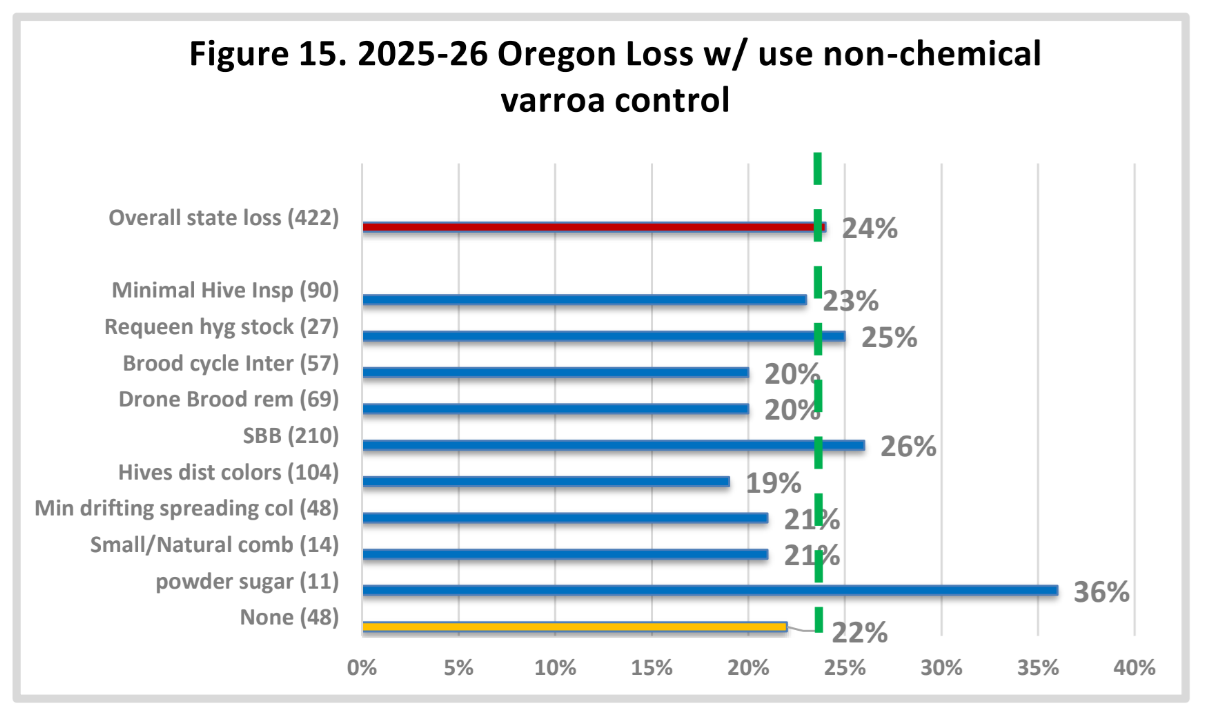
Two of the non-chemical alternatives have demonstrated reduced losses over the past several survey years. Reducing drifting such as spreading colonies for past 7 years – question not asked in 2016-17 survey, and brood cycle interruption have consistently, year after year, demonstrated somewhat better survival than average loss (21% and 20% respectively this year). Different colony colors in apiary (19%) and drone brood removal (20% loss) were helpful managements also this year. Among other non-chemical treatments, one person said they used the Bee Gym device to help promote hygienic behaviors, but they lost 2 of 4 colonies.
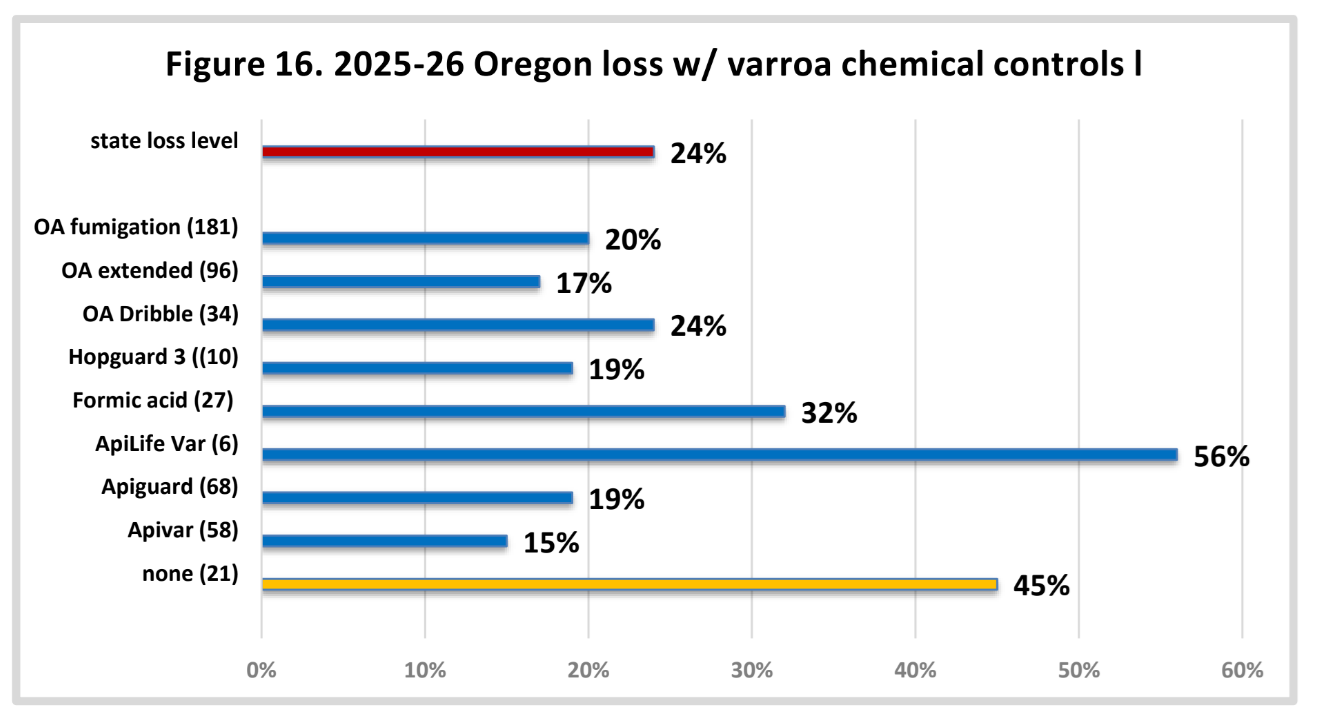
Chemical control: For mite control via use of chemicals, 21 individuals (7% of total respondents not using Fast track) used NO chemical treatment. They had a loss level of 45%. The 148 individuals who used FAST TRACK and did not supply information had a loss level of 29%. Those using chemicals used at a rate of 2.3/individual last year, same as in the previous year. One hundred three individuals using a chemical (43%) used one chemical. Overall, these individuals had a 30% loss level. Individuals who used 2 chemicals (80 individuals – 33% of respondents, had 22% loss. The forty-six individuals that used 3 chemicals did even better – 18% loss, while the 10 individuals using 4 or 5 chemicals had a 7% loss. It is clear that use of chemicals improves survival. For this data different oxalic use was counted as a separate use. Figure 16 shows usage and loss levels.
Apivar: The number of times a chemical was used was captured in the survey. For example, of the 58 individuals who used Apivar, the synthetic miticide amitraz, one respondent reported using it 6+ times (30% loss), two used it three times (24% loss), 13 individuals used it twice (27% loss) and 40 individuals used it once and reported 11.5% loss. Legally it is permitted to be used twice per year. Overall, for the 58 Apivar users, there was 15% loss. It continues to provide excellent varroa mite control for Oregon backyarders. Overall loss rate is shown in Figure 16.
Essential Oils: Apiguard, the essential oil gel, had a very decent modest gain of 2 percentage points over statewide average – 22% survival level. It was used four times by two individuals, they had 8% loss, four individuals used it 3 times (14% loss), 15 individuals used it twice, 35% loss and the 47 individuals using it once had a 20.5% loss level. There were only 6 individuals who used APiLifeVar, also an essential oil miticide. Overall loss=55% for this miticide. In previous years, losses were below the statewide average.
Formic Acid: Formic acid is a powerful acid capable of causing collateral damage to the bee brood and is sometimes a queen killer. Two individuals used it three times with only a single colony of 8 fall colonies surviving for 87.5% loss level. The nine individuals who used it twice had a 40% loss while the 16 individuals who employed it once for varroa control had an acceptable loss level of 23%. Overall, the 27 formic acid users did not do very well with mite control – they had a 32% loss.
Hopguard: this is another miticide acid. Only ten individuals used it. The single individual using it twice lost 6 of 8 colonies while the nine individuals who used it once lost 6 colonies of 56 fall hives. Overall loss level was 19%.
Oxalic acid: the vast majority of individuals treating for mites chemically used oxalic acid in one of three ways, as drizzle (OAD), vaporization (sublimation) OAV and oxalic acid in absorbent pads meant to keep oxalic acid in the hive for an extended period (OAE), available for the first time late in the year as VarroxSan. Eleven individuals did indicate VarroxSan use – they had a 27% loss level. Overall, oxalic acid was used on 2411 fall colonies and had a 19% loss level.
QAD: One individual drizzled 6+ times and didn’t lose any of their 4 colonies and the individual that used it 5 times had similar full survival on their 5 colonies. Four individuals used it three times (35% loss), two individuals used it twice (7% loss) and the 26 individuals that used OAD once had a 20% loss. Overall, the 34 individuals using OAD had a 24% loss level.
OAE: This is a relatively “easy” way to use oxalic acid. Ninety-six individuals used it to control mites and collectively had only a 17% loss. Six individuals used it 6+ times and had a 26% loss, the three individuals using it 5 times had a 41.5% loss. Three individuals used it four times with an 18% loss, 9 individuals used it three times with a 26% loss, the 28 respondents using it twice had 18.5% loss and the 47 individuals that used it once had a 10% loss.
OAV: A total of 181 individuals used oxalic acid vaporization to control mites. They did this on 1379 colonies, 1101 survived for a 20% loss level. Forty-two individuals used OAV 6+ times and had a 25% loss, nine individuals used it 5 times with a 12.5% loss and 20 individuals used it four times with a 24% loss. It is unclear why use five times would perform better than 4 or 6+ times? The 30 individuals using it 3 times had a 17.5% loss, the 40 individuals using it twice had a 22% loss and those 40 individuals using it a single time had a 15.5% loss. Why might one use do a better job of varroa control compared to use twice? Of course, we do not know what else was used or when the sole use beekeepers used it compared to those using it twice.
Other chemicals used included mineral oil – the single user lost 2 of 8 colonies = 25% loss and use of oregano oil, again a single user, but in this instance all 3 colonies survived (0% loss) and finally the 3 powdered sugar users lost 1 of 8 colonies = 12.5% loss.
Consistently, over the last 9 years, four different chemicals have helped beekeepers improve survival. These were the synthetic Apivar, essential oils Apiguard and ApiLifeVar and Oxalic acid vaporization. This season, ApiLifeVar did not provide adequate control for the 6 individuals using it. The average loss level has been 35.7% in the last 8 years. Formic acid too has done better than average in the last 9 years, but the product has changed from MAGS to Formic Pro so I cannot be sure what Formic acid product was used by the 27 respondents who reported using it. Oxalic acid drizzle did not do as well this year (24% loss level), but OAE did very well in promoting better than average survival (17%) and the substantial number of users of OAV (181 individuals) had very favorable result at 19.5% loss level. For most chemicals used more than once, the results are not illustrative of what number of times is most useful, but numbers are small for most.
Antibiotic use
Five individuals (less than 1 percent) used Fumagillin (for Nosema control) and had a 20% loss rate. Three individuals indicated use of Terramycin, they had 35% winter loss.
Queens
We hear lots of issues related to queen “problems”. Queen events can be a significant factor contributing to a colony not performing as expected. One hundred ninety-nine elected to FAST Track and did not respond to this final set of questions. They had loss level of 27%. The 243 who responded had same as average loss level of 24%. One hundred respondents said they had marked queens; they lost 21%; no responders had a 26% loss level. The related question then was ‘were your hives requeened in any form?”, to which 164 individuals) said yes (22%loss). When asked how colonies were requeened (multiple answers were possible) 76 said their colonies swarmed and 48 said their colonies superseded. Twenty-seven said they split colonies, and they raised an emergency queen presumably. A total of 77 said they introduced a mated queen (19% loss), 10 introduced a virgin queen and 33 said they introduced a queen cell; they had an 18% loss.
Closing comments
I intend to continue to refine this instrument each season and hope you will join in response next march/April. If you would like a reminder when survey is open, please subscribe to the mailing list. I have a blog on the pnwhoneybeesurvey.com and will respond to any questions or concerns you might have. Email me directly for quicker response: dmcaron@udel.edu.
I whole heartedly thank Jenai Fitzpatrick, who has been an invaluable assistant through the years with the data and to Bill Catherall who has been our webmaster for PUB and who has graciously continued with the loss survey. For different reasons, neither individual now keeps honey bees, so for both this is a labor of love. Both say it is payback to those years they had bees and the wonderful friendships developed among the beekeepers.
Thank You to all who participated. If you find any of this information of value, please consider adding your voice to the survey in a subsequent season.
Dewey Caron May 2026
Winter Bee Losses of Washington Backyard Beekeepers for 2025-2026
by Dewey M. Caron
Click here to view a PDF of Washington report.
Overwintering losses of small-scale Washington backyard beekeepers = 30% a decrease of four percentage points from last year, 14 percentage points below the 10-year loss average. Two hundred twenty-seven Washington beekeepers, 97 more than last year, completed a survey; respondent number was 106 above the 120.8 average respondent rate for the last seven years. Individuals maintained 547 fall colonies. Information on winter losses and several managements related to bee health is on the website www.pnwhoneybeesurvey.com.
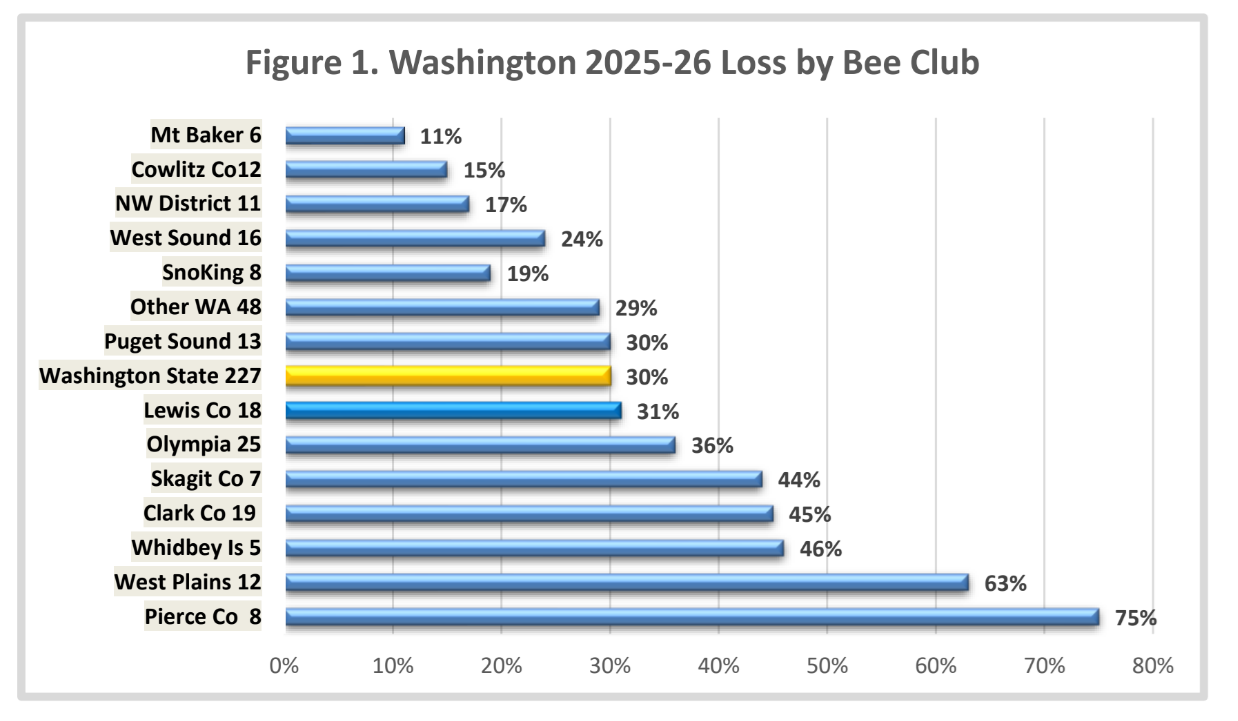
Response by local Washington (WA) association members varied as indicated by numbers adjacent to club name. Losses of those club individuals are shown in blue bars in Figure 1. The other category included clubs with fewer than 5 responses and other respondents who did not indicate a club membership. Statewide loss level was 30%. The survey included 1547 fall Washington beekeeper colonies (871 more than last year). Thank you for the great returns.
2025-2026 Overwinter Losses by Hive Type
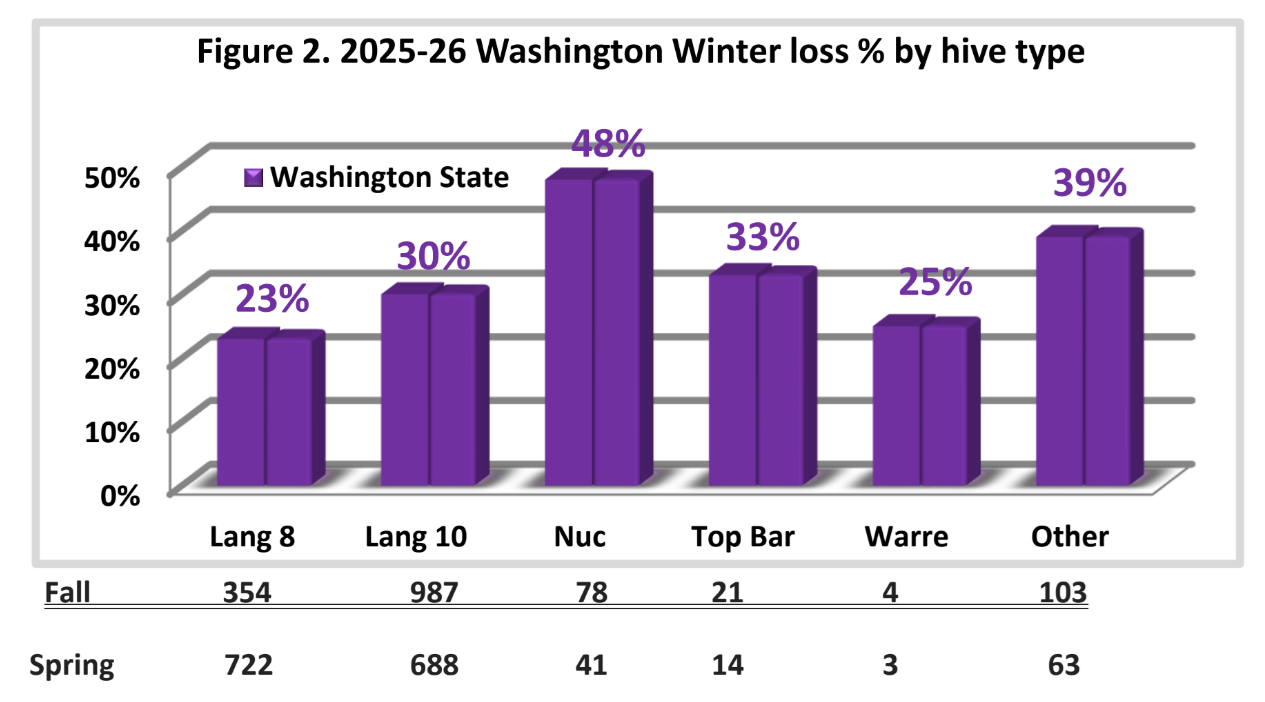
The Washington survey overwintering loss statistic was developed by subtracting the number of spring surviving colonies from fall colony numbers supplied by respondents by hive type. Results, shown in Figure 2 bar graph, illustrate overwintering losses of 227 total WA beekeeper respondents. Langstroth 8-frame beehives had lower average losses (23%) compared to Langstroth 10-frames hives (30%). Nucs losses were 47.5%. There were 21 Top Bar hives with 1/3rd lost. There were only 4 Warré hives and 3 survived. Of the 103 colonies listed under “other” hive type, 4 individuals had 13 AZ (Slovenian) hives (8 survived), 2 had Apimaye hives (1 survived), the single Layens hive survived, of 2 flow hives 1 survived (these 3 hive types all owned by one individual each), 8 individuals had 23 long/horizontal hives with 16 surviving, 6 individuals had 25 IQ hives with only 4 lost overwinter and there were 37 hives not identified to type (10 individuals – 37 fall and 17 in spring).
Eighty-one individuals had no loss (329 colonies, range 1-20) while 36 beekeepers lost 100% (84 colonies, range 1-10). The greatest loss was 22 colonies. See Figure 3 graph. Thirty-six individuals (16%) lost between 2-25% of their colonies (12% loss rate), 47 individuals (21%) lost between 29-59% of their colonies (loss rate 38.5%), 19 individuals lost between 53-75% of their colonies (60% loss rate) and 8 individuals lost between 80-98% of their colonies (loss rate 84.5%).
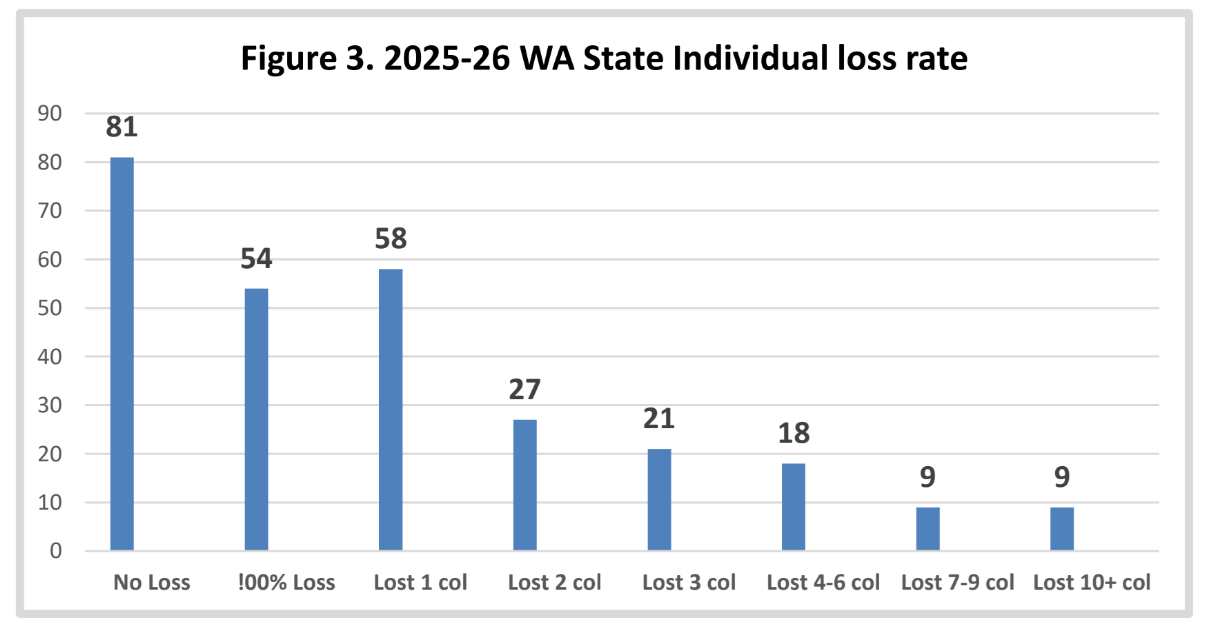
The WA respondents to the electronic survey managed up to 49 fall colonies. Thirty-one individuals had a single colony. The 31 individuals lost 13 (a 42% loss). Individuals with 1 to 3 fall colonies (108 individuals) lost 41%, fifty-one individuals had 4 to 6 fall colonies with loss level of 30% (four was the median number, average colony number = 6.8 colonies), the 26 individuals with 7 to 9 colonies lost 27%, the 23 individuals with 10-19 colonies lost 37% and the 19 individuals with 20-49 colonies lost 23.5%. Fifteen individuals (6.5% of total Washington respondents) had a single year of experience – they lost 20 of their colonies =37.5% loss. Sixty-one respondents (37.5% of total) had 1, 2 or 3 years of experience; they had a 37% loss level. Seventy-six individuals (27% of total respondents) had 4 – 6 years’ experience (medium number = 5 years’ experience) with a 33.5% loss, 30 individuals had 7-9 years’ experience (loss level 29%), 45 had 10-18 years keeping bees and 39% loss level and the 15 individuals with 20 to 64 years’ experience lost 24% (7 individuals with 31-64 years’ experience, the maximum beekeeper experience years) had a 17% loss level. Examining the relationship of colony numbers and years’ experience related to loss shows that loss of colonies decreases by about 1/2 and with a greater number of colonies while loss by years of experience also shows a slightly lower decrease in loss percentage.

One hundred sixty-three (72%) WA beekeepers had an experienced beekeeping mentor available as they were learning beekeeping. This percentage was nine percentage points lower than last year, and five percentage points lower than the 10-year average.
Survival Based on Hive Origination
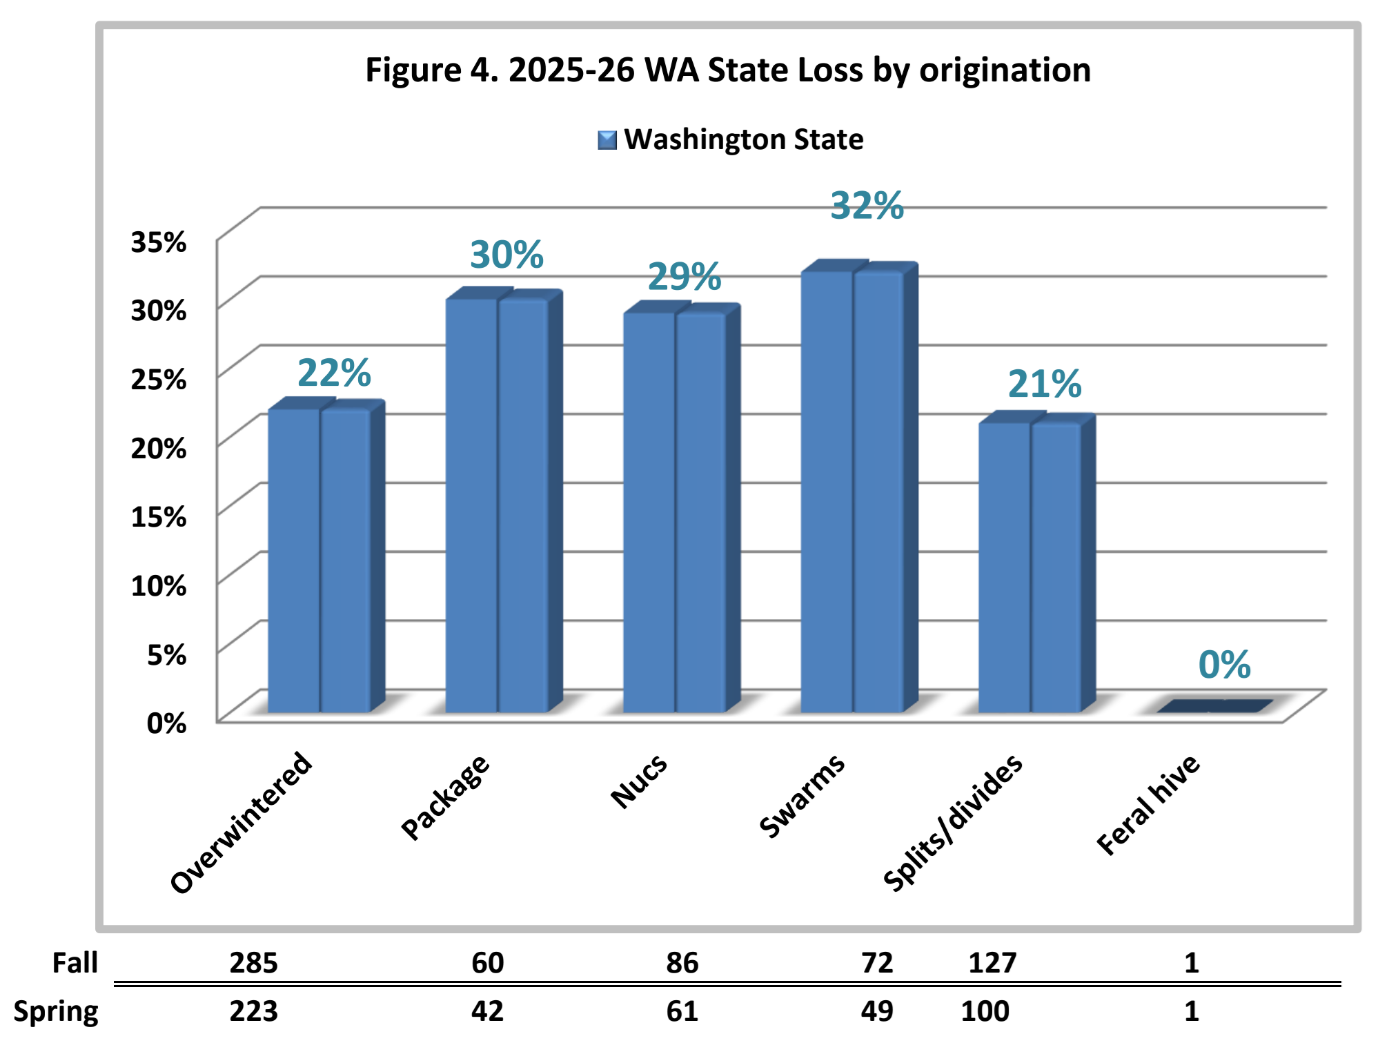
We also asked about hive loss by origination. This year individuals could FAST TRACK the survey and bypass this question. Fifty percent, 113 individuals, did answer. Data shown in Figure 4 below. The best survival was previously overwintered, with a 22% loss rate, 80 individuals. Packages overwintered by 28 individuals had 30% loss Overwintered Nucs, 86 fall colonies, had 29% loss. There were 45 individuals overwintering swarms, 72 colonies, they had 32% loss. Forty-five individuals overwintered splits, 127 total and they had 21% loss. The one overwintered feral transfer survived.
Comparison to Larger-Scale Beekeeper Losses
The BeeInformed.org (BIP) losses for Washington beekeepers from 2015 to 2023, the last year of the BIP survey, are representative of the larger scale beekeepers and are shown in blue in Figure 5. In 2024 a new National survey was started by the group Apiary Inspectors of America, Auburn University and Oregon State University. Overwintering losses in this initial survey year were 37.7%. Losses of backyard beekeepers from this survey are shown in orange line with black loss numbers. The 30% current wintering period loss is added at end. The response number is shown below the graphic. Average BIP loss (9 years) =27.9% and average WA backyarder loss (12 years) = 42.8%. In 2023 the larger-scale beekeeper loss exceeded losses of backyarders. The numbers included in the survey are shown below the figure.
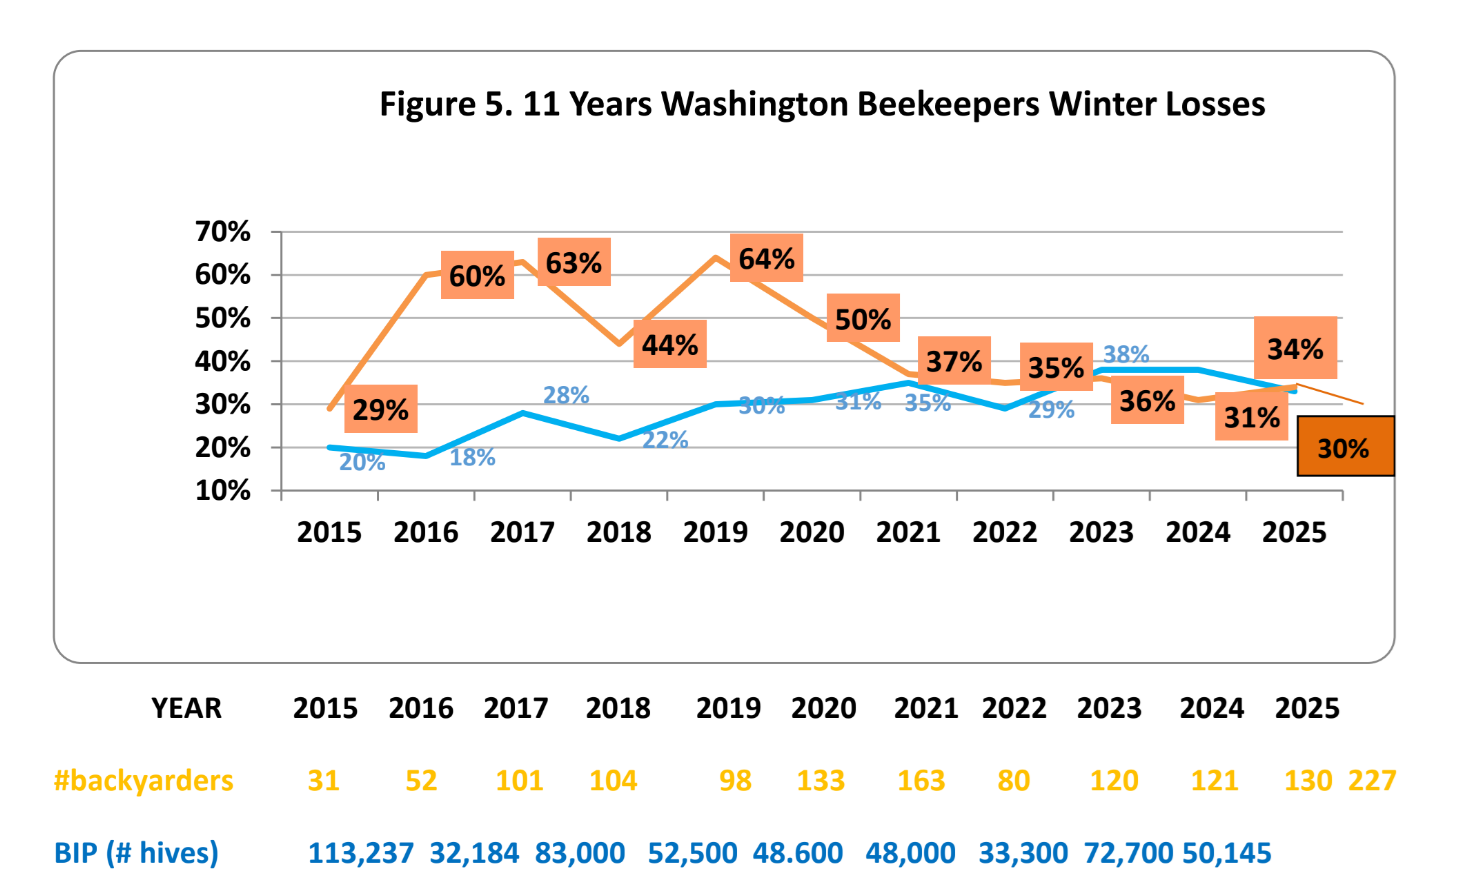
The BIP survey includes a mailed survey to larger-scale beekeepers and an electronic survey to which any Washington beekeeper can submit their data. Losses reported include colonies of migratory beekeepers who reported WA as one of their yearly locations. The BIP survey for the 2015-23 annual surveys reports receiving responses from 90 to 95% of respondents exclusive to Washington but they managed less than 5% of total colony count – thus, we can conclude the BIP tally is primarily of commercial beekeepers. They have large numbers of colonies in survey data, so the BIP losses reflect commercial losses not losses of backyarders.
Apiary sites and moves
Fifteen survey respondents had bees at more than a single apiary. Loss levels were similar or better at 9 of the original sites and better at 4 of the 2nd sites. Four had bees at a third site and losses were higher at one of the 3rd sites. Seven individuals moved bees. One moved for pollination, one moved for better site, one moved due to yellow jacket predation and the other four moved for
reasons due to loss of site.
Colony death perceived reason and acceptable loss level
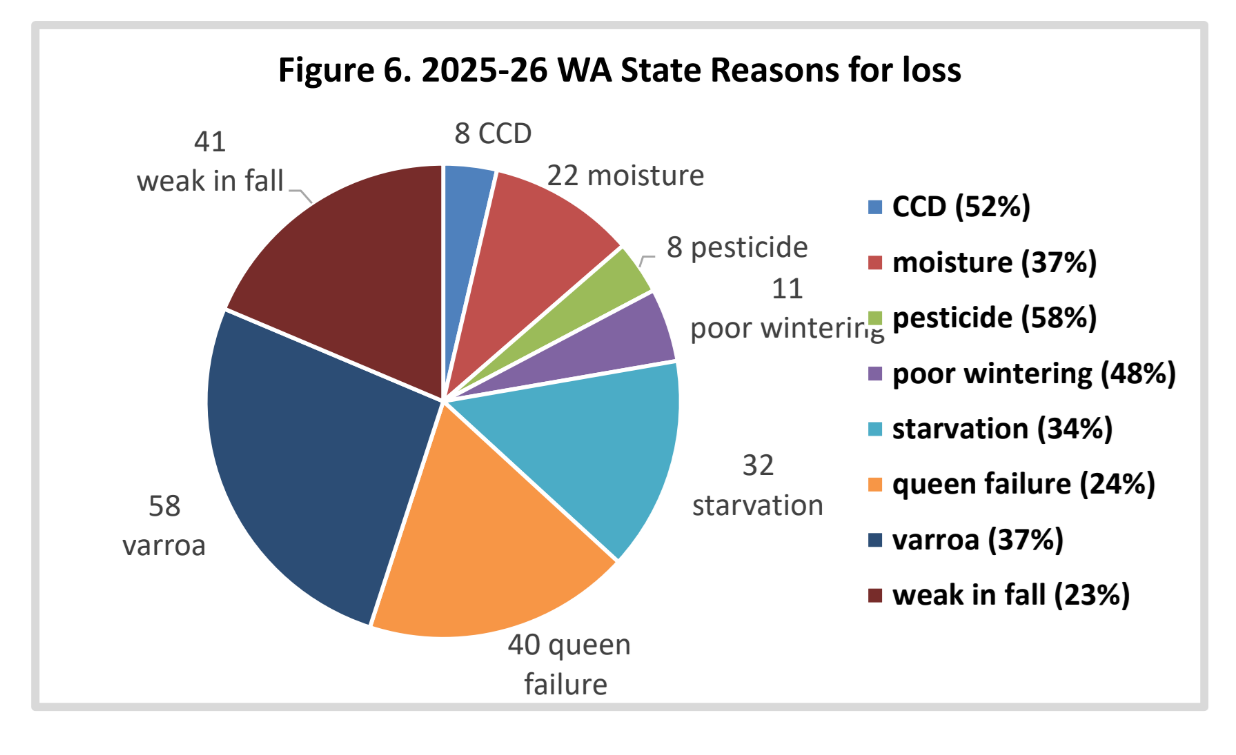
We asked survey takers who had winter losses for the “reason” for their losses. More than one selection could be chosen. In all there were 242 WA selections (1.2/individual) provided. Twenty-two individuals didn’t know – they had a51.5% loss level. Varroa mites (58 individuals, 28% of total selections) was the most common choice; they had a 37% loss. Queen failure (40 individuals, 20% of selectors had a 24% loss rate. Weak in the fall (41 individuals, 20% of selections, with 23% loss), starvation, 32 individuals, and poor wintering, 11 individuals were also common choices. Six listed absconding (69% loss), 3 said robbing (9% winter loss) and one listing each for wax moth, blocked bottom board, small population, poor hive design, late freeze, lack of attention. And bear attack. Figure 6 below shows the number and percent of factor selections. Not illustrated is yellow jackets,
22 selections with a 62% loss.
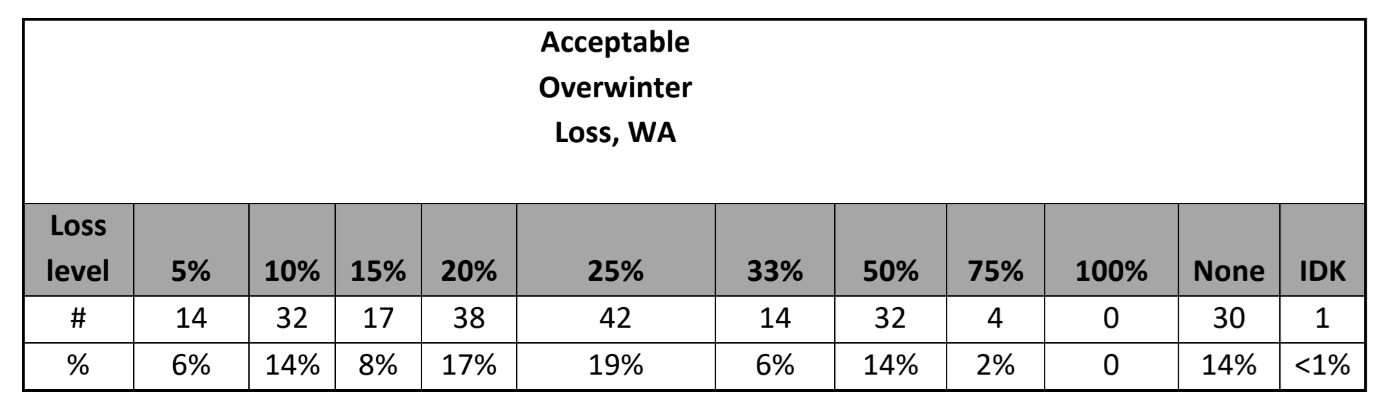
Acceptable loss: Survey respondents were asked the reason for loss. Thirty (14%) indicated zero (no loss). Thirty-four percent of individuals indicated 10% or less. Twenty percent was medium choice. Thirty-two said 50%+ was an acceptable loss level and another 4 said 75% was acceptable. See the table below.
Why do colonies die?
There is no straightforward way to verify reason(s) for colony loss. Colonies in the same apiary may die for several reasons. Examination of dead colonies is at best confusing and, although some options may be ruled out, we are often left with two or more possible reasons for losses. A dead colony necropsy can be of use. Opinions vary as to what might be an acceptable loss level. We are dealing with living animals which are constantly exposed to many different challenges, both in the natural environment and the beekeeper’s apiary. Individual choices varied from zero to 75%, with a medium of 20%.
Major factors in colony loss are thought to be mites and their enhancement of viruses especially DWV (deformed wing virus), VDV (Varroa destructor Virus (also termed DWV B) and Israeli and chronic paralysis viruses. But we do not have a test for these viruses. It was interesting that queen problems were the most frequently indicated as were weak in the fall after varroa as leading
reasons for loss.
Declining nutritional adequacy/forage and diseases, especially at certain apiary sites, are additional factors resulting in poor bee health. Yellow jacket predation is a constant danger to weaker fall colonies. Management, especially learning proper bee care in the first years of beekeeping, remains a factor in losses. What effects our changing environment such as global warming, contrails,
electromagnetic forces, including human disruption of them, human alteration to the bee’s natural environment and other factors play in colony losses are not at all clear.
There is no simple answer to explain the levels of current losses nor is it possible to demonstrate that they are necessarily excessive for all the issues our honey bees face in the environment. It was encouraging to see from survey responses that losses this past year, 30% were still at a low level. More attention to colony strength and the possibility of mitigating winter starvation will help reduce some of the losses. Effectively controlling varroa mites will help reduce losses.
Colony Managements
Most Washington beekeepers do not perform just one management to their colony (ies) toward improving colony health and overwintering success. This analysis compares a single factor equated with loss level. Such an analysis is correlative and doing a similar management as performed by another beekeeper does not necessarily mean you too will improve success. Individuals could FAST TRACK in their survey responses this year. Last year, for these first managements, 91 individuals (70%) supplied management information; for the current survey respondents, 161 (71%) supplied management information.
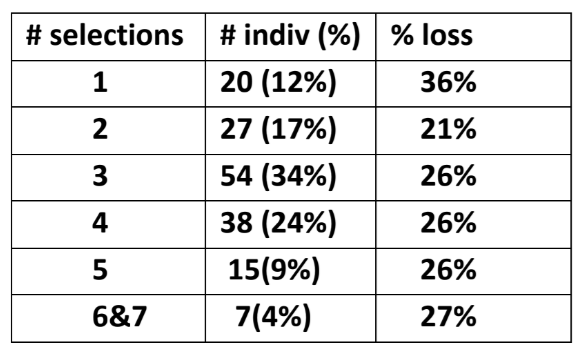
FEEDING: Washington survey respondents checked feeding options = 3.15/individual (last year it was 3.4/individual). Two individuals that fast tracked had a 37% loss. Three individuals made no selections – they had 46 colonies and all but one survived (25% loss). Twenty respondents indicated a single choice but lost 36 of 100 colonies for 36% loss. The most favorable outcome was two feeding managements. The table illustrates the relationship of number of selections to percent making selection (median was 3) and percent loss of those individuals. May not =100% due to rounding.
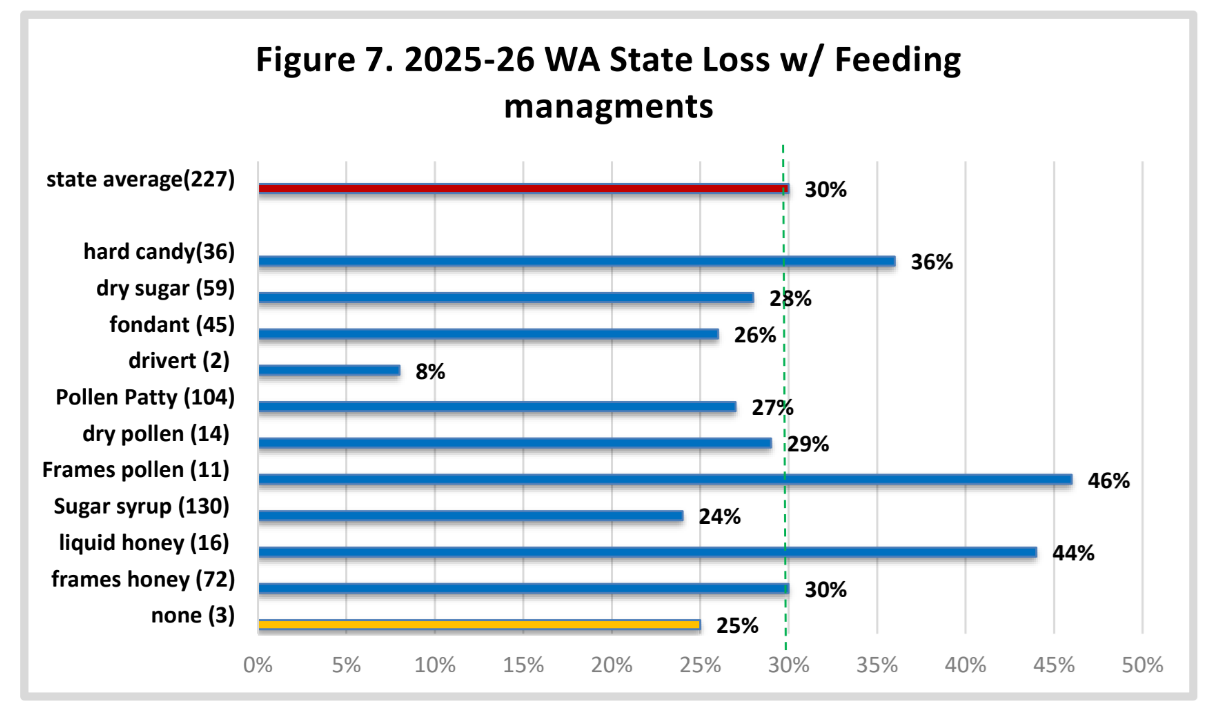
The choices, with number of individuals making that selection, is in ( ), bar length indicates loss level of individuals doing this management (Figure 7). Those bar lengths to left of 30% (green dashed line) had better survival while those to right had greater loss level.
Feeding sugar syrup (130 individuals) and pollen patties (104 individuals) were the most common feeding options of respondents. Syrup feeders had a six-percentage point better survival while the pollen patty feeders with 27% loss rate had a 3-percentage point better survival. The Dry sugar feeders (59 individuals) also had a two-percentage point improvement over overall loss rate. The 3 who checked “other” practices, feeding hive alive, showed good survival, 25% loss.
For the last 6 years of survey losses statewide, individuals doing no feeding had poorer survival in 6 of the 8 years, but numbers of individuals/colonies involved were generally low – this year three individuals with 4 colonies had 25% loss. Individuals that fed sugar syrup had lower loss level in five of eight years (including this year).
Individuals feeding non–liquid sugar in the form of hard candy had lower losses in 5 of 8 years; this year 6-percentage points lower survival. For 111 individuals feeding protein showed slightly better survival in 5 of 8 years (this year 2-percentage points better survival).
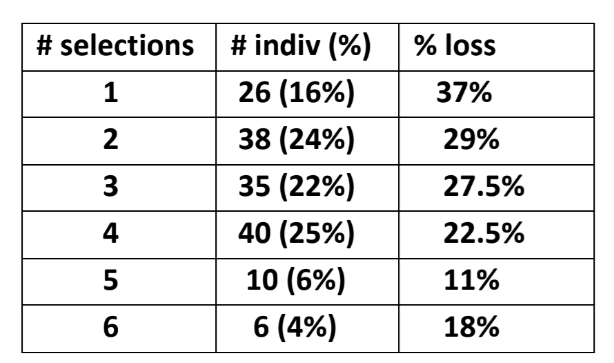
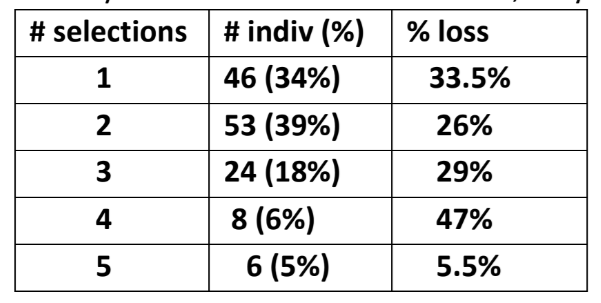
WINTERING PRACTICES: We received 460 responses (2.9/individual) same as last year for responding WA beekeeper wintering management practices (more than one option could be chosen). Sixty-six individuals fast tracked and didn’t respond; they had a loss level of 37%. Six individuals said they did none; they lost only 3 of 21 fall colonies for 14% loss. The greater the number of selections the better the survival. Information on selections and loss rate in table.
The managements selected that improved survival were rain shelter (59 individuals, 18.5% loss) and equalized hive strength (33 individuals, 20% loss). Most popular choices were top insulation (91 individuals 91 individuals 27% loss) and ventilated top (90 individuals 25.5% loss). Figure 8 shows the number of individual choices and percentage of each selection. All choices improved over average loss (30%) except for wrapping colonies, which was only a 1⁄2 percentage point poorer – 30.5% loss. Among other selections were three individuals with IQ hives – they had a 40% loss (statewide IQ hives did much better – 16% loss, only 1⁄2 the statewide level), protection by vegetation, sunny location, cleaned bottom board mid-winter and crush and strain so bees bult new comb.
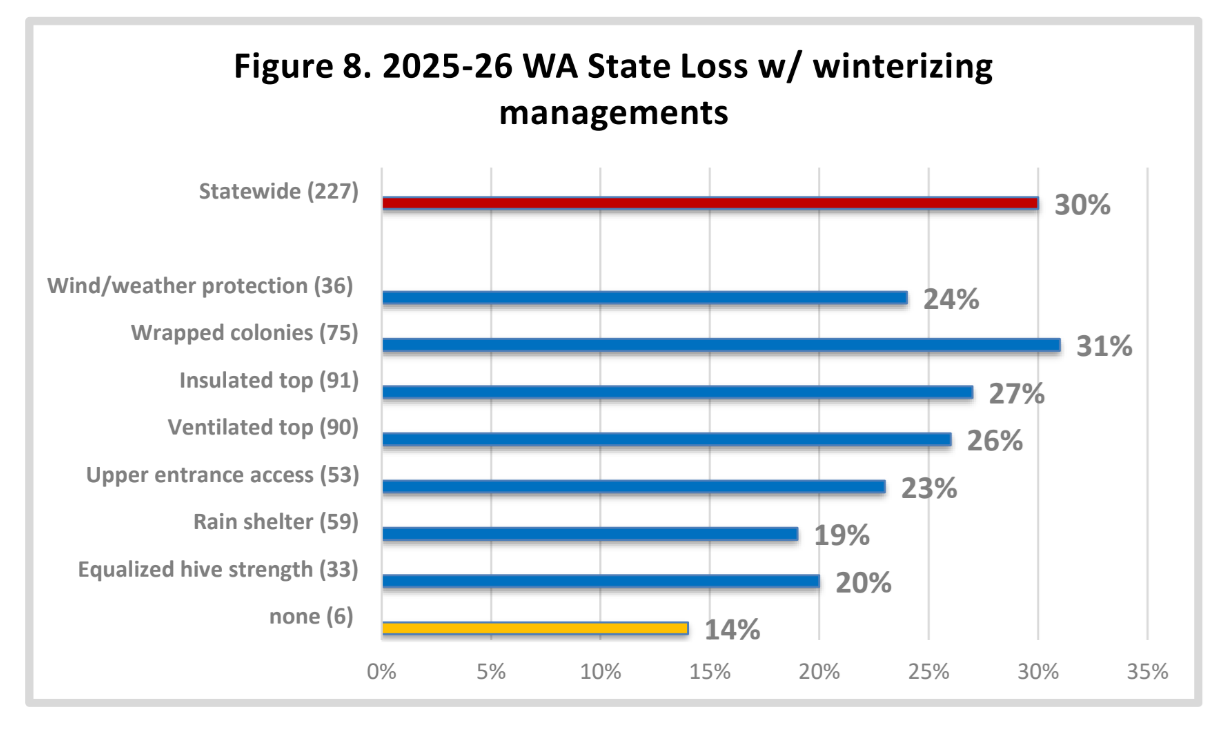
Over the past 7 years a couple of winterizing managements have shown improved survival. Those doing no winterizing had higher losses 7 of 9 years; this year the six individuals with 21 colonies lost only 3 for a 14% loss and last year the two 2 individuals had a 33% loss (last year’s average loss statewide was 34%) but it was based on only 3 colonies. Equalizing hive strength in the fall
demonstrated lower loss levels in all eight recent winter periods (as in this one) and top insulation has demonstrated lower loss in six of eight winters – this winter a 3-percentage point advantage. Ventilation above the colony (Vivaldi Board/quilt box) demonstrated improved survival five of the eight winters; last year loss level was higher by 5 percentage points compared to overall loss and this year by 4.5 percentage points. The 29% of individuals (66) who did the FAST TRACK and did not indicate any managements had a 37% overwinter loss rate. Last year it was 30% of respondents and they had a 46% loss level, 12 percentage points higher than statewide average of 34%.
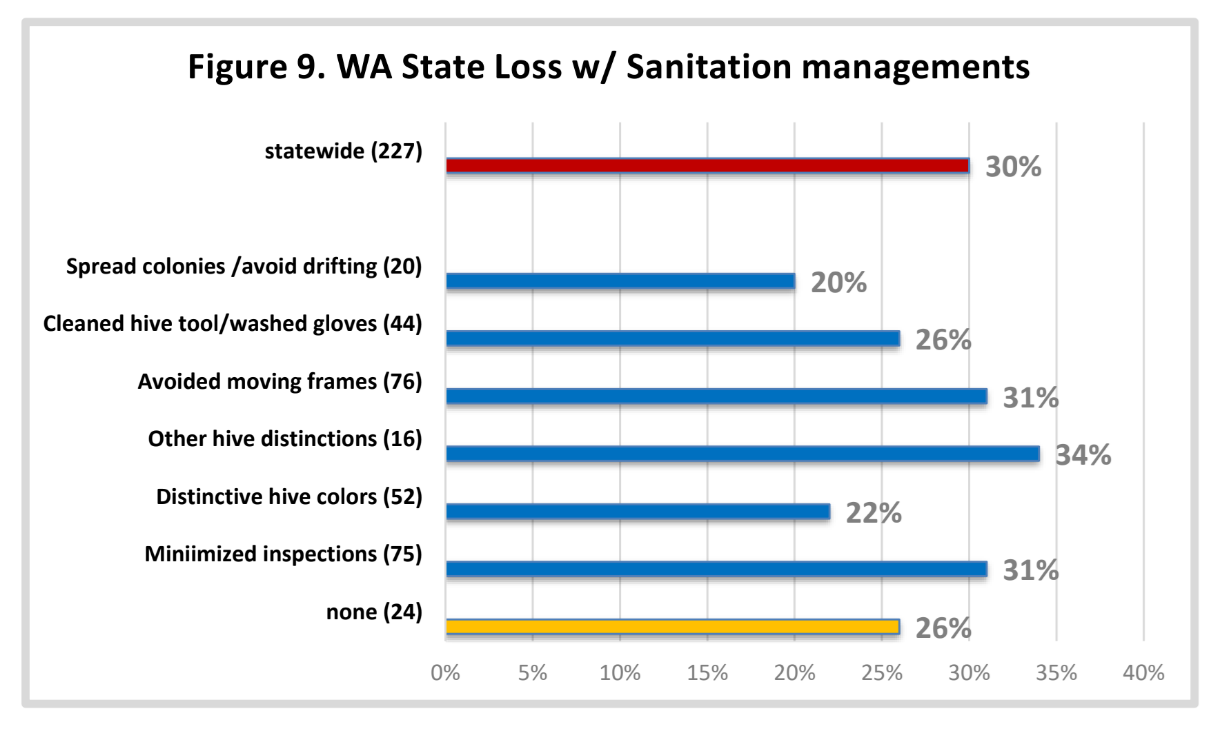
SANITATION PRACTICES: It is critical that we practice some basic bee sanitation (some prefer use of term bee biosecurity) in our bee care to help ensure healthy bees. We received 311 responses for this survey question 2.3/individual for those selecting other than none, same as last year). Twenty-four individuals (15%) said they did not practice any of the six offered alternatives; they had a loss rate of 26%, four percentage points lower than the statewide average. The 66 individuals who used Fast Track (no response) had a 37% loss.
It is clear that none of the measures are robust enough to make a difference by itself in reducing winter loss. Figure 9 shows the number of individual choices and percentage of each selection. Bar length less than 30% had better than average winter survival. In all seven years doing none of these managements resulted in anything approaching better than average survival; last year the 18 individuals doing nothing had average statewide losses, this year the 24 individuals had a 26% loss, four percentage points better than statewide average. The managements of reducing colony drift by spreading colonies and providing hives with distinctive colors were managements most helpful by 10 percentage points and 8 percentage points respectfully for improving overwintering success.
SCREEN BOTTOM BOARDS (SBB)
Although many beekeepers use SBB to control varroa mites, BIP and PNW surveys clearly point out they are not or at best not a very effective varroa mite control tool. Those 66 individuals who used Fast track (no response) had a 37% loss. The 25
Washington individuals (15.5%) who said they did not use screen bottom boards lost 32.5% of their colonies. Those 31 beekeepers using SBB on some of their colonies lost 22.5% and the 105 individuals (65%) using SBB on all of their colonies had 27.5% loss.
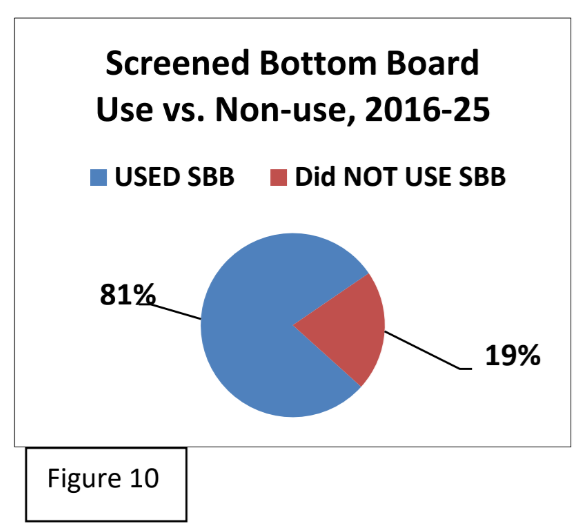
In nine survey years 19% of Washington beekeepers said they did not use SBB and 81% did use SBB on some or all of their colonies, see Figure 10.
Examining the eight-year average SBB use, those using SBB on all or some of their colonies had a 40% loss level whereas for those not using SBB the loss rate was 40.9%, <1% positive survival gain for those using SBB versus those not using them. SBB is a very minor aid in improving overwinter survival for Washington beekeepers.
We asked if the SBB was left open (always response) or blocked during winter season. Eighty-three individuals (59%) said they always blocked SBB during winter. They had a 25.5% loss rate. Forty-five individuals (32%), a surprisingly sizable percentage, said they never blocked SBB and had a loss rate of 26%. Twelve individuals (8.5%) blocked them on some of their colonies. Their loss rate was 33%. So, the 65 individuals that blocked or sometimes blocked screen boards had 33% loss. Over the past seven years, those closing have nearly an 8-percentage point advantage when the SBB is closed during the winter (although it was the opposite this season). There is no good science on whether open or closed bottoms make a difference overwinter, but some beekeepers “feel” bees do better with it closed overwinter. An open bottom, at least during the active brood rearing season, can assist the bees in keeping their hive cleaner and promote good hive ventilation.
Things that seem to improve winter success: It should be emphasized that these comparisons are correlations not causation. They are single comparisons of one item with loss numbers. Individual beekeepers do not do only one management option, nor do they necessarily do the same thing to all the colonies in their care. We do know moisture kills bees, so we recommend hives be located in the sun out of the wind. If exposed, providing some extra wind/weather protection might improve survival. Early spring pollen is important so locations where bees have access to anything that may be flowering on sunny winter days is also good management.
Feeding, a common management, appears to be of some help in reducing losses. Feeding hard sugar candy or fondant during the winter meant lower loss levels. Providing honey or sugar syrup, the most common selection, does not usually mean lower winter losses (but sugar syrup feeders did better this year). These basic managements are useful in other ways such as for spring development and/or development of new/weaker colonies besides insuring better winter survival.
Feeding protein dry or as pollen patty does seem to slightly improve survival. The supplemental feeding of protein (pollen patties) might be of assistance earlier in the spring season as it has been demonstrated to help bees build strong colonies, but this may lead to greater swarming.
Winterizing measures apparently help lower losses for beekeepers. Rain shelter and top insulation, spreading colonies out in the apiary and painting distinctive colors or doing other measures to reduce drifting are of value in reducing winter losses.
Replacing standard bottom boards for screened bottoms only marginally improved winter survival. It is apparently advantageous to close the bottom screens during winter.
Mite monitoring/sampling and control management
We asked the percentage of Washington hives monitored for mites during the 2025 year and/or overwinter 2025-26, whether sampling was pre- or post-treatment or both and, of the five possible mite sampling methods, what method was used and when it was employed. Fifty-three
Washington respondents did not provide a response and did FAST TRACK for this section. They had a 52% loss. One hundred and nine (60.5% – a decrease of 4.5 percentage points from last year) said they monitored all their hives. Losses of those individuals monitoring was 22%. Thirty-four (19%) reported no monitoring; they had a higher loss rate of 25.5%. Thirty-seven individuals monitored some with a loss rate of 34%.
In order of popularity of use, 86 individuals used sticky boards (27.5% loss), 79 used alcohol wash (26%), 69 examined worker adults (28.5% loss), 59 looked on drones or drone brood, 26% loss and 17 used powder sugar, 27% loss. Monitoring helps as management to reduce losses.
Most sampling to monitor mites was done in July – September, as might be expected since mite numbers change most quickly during these months and results of sampling can most readily be used for control decisions.
The most common sampling of respondents in 2025-26 was sampling both pre and post (56 individuals 59% of responses); they had 21% loss, nine percentage points lower than overall lost rate for Washington beekeepers. Those 28 sampling pre had a higher loss rate (35%) while those 11 only sampling post treatment had a 21% loss. The 26 individuals who treated without sampling had a 21% loss. The three individuals that sampled but did not treat lost 55% of their colonies.
It is important to KNOW mite numbers. Mite monitoring methods did not vary. Sticky (detritus) boards below the colony can be a challenge (often so much detritus drops onto a sticky board that picking out the mites can be hard, especially for new beekeepers) but sticky boards used for a day can help confirm the efficacy of a treatment when inserted post treatment. Visual sampling is not accurate: most mites are not on the adult bees, they are in the brood. Unfortunately looking for mites on drone brood is also not effective as a predictive number but can be used as an early warning that mites are present; if done, look at what percentage of drone cells had mites.
See Tools for Varroa Monitoring Guide www.honeybeehealthcoalition.org/varroa on the Honey Bee Health Coalition website for a description of and to view videos demonstrating how best to do sugar shake or alcohol wash sampling. The Tools guide also includes suggested mite level to use to base control decisions based on the adult bee sampling. A colony is holding its own against mites if the mite sample is below 2%. It is critical not to allow mite levels to exceed 2% during the fall months when bees are rearing the fat fall bees that will overwinter. It is also the most challenging time to select a control method (if one is deemed needed) as potential treatment harm may negatively impact the colony. We are seeing more colonies suddenly disappear (abscond?) during the fall, which may be related to the treatment itself.
Mite Control Treatments
The survey asked about non-chemical mite treatments and also about the use of chemicals for mite control. A total of 172 answered this question for non-chemicals, with the remainder electing to FAST TRACK – those 55 not responding to non-chemical treatment had a 50% loss and the 63 non-respondents for chemical use had a 48% loss. Twenty-seven individuals (15.5%), 1.5 percentage points greater than last year, of respondents said they did not employ a non-chemical mite control. Five respondents (3%) did not use a chemical control. Those 27 individuals who did not use a non-chemical treatment reported a 63% winter loss and the 5 not using a chemical control had a 49% loss.
The individual options chosen for non-chemical and chemical control are discussed below.
Non-Chemical Mite Control: Of nine non-chemical alternatives offered on the survey (+ other category), three hundred seventy-eight selections were indicated 2.2 (up from 1.7/person last year but same as year before 2.2/individual). The 54 individuals who FAST Tracked and did not respond had a 50% loss level. Thirty-eight individuals used one method and had an 18% loss, 51 used two (21.5% loss level), 31 used three (24% loss), 14 used four (13.5% loss) and 12 used 5 or 6 and had a 29.5% loss. There is no correlation that with increased number of selections that loss level will decrease.
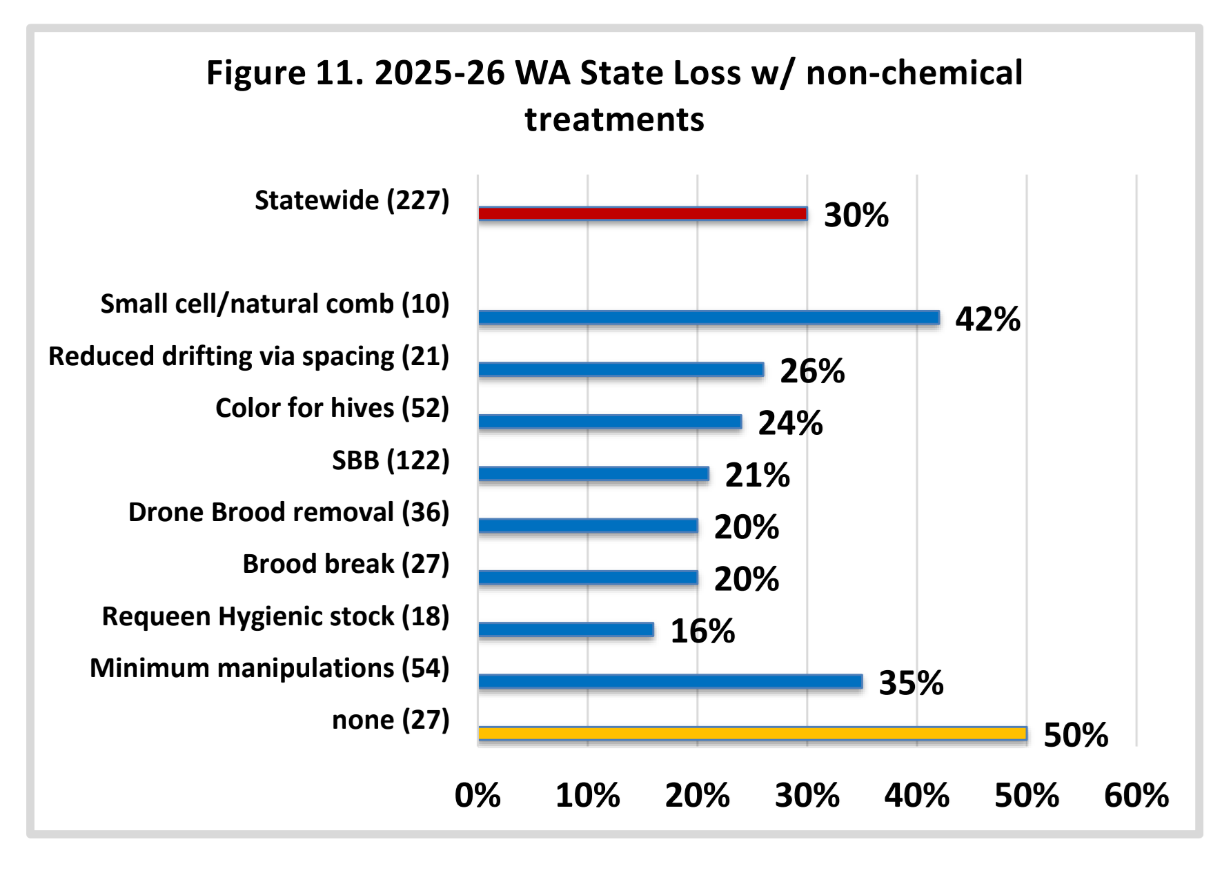
Use of screened bottom board was listed by 122 individuals (83.5% of individuals selecting other than none). They had a 20.5% loss level. The best survival choices were requeening with hygienic stock by 18 individuals (16% loss), and brood cycle interruption (27 individuals had a 19.5% loss) and drone brood removal (36 individuals) also a 19.5% loss rate. The use of the remaining seven selections is shown in Figure 11; number of individuals in ( ), bar length represents average loss level of those individuals using each method.
Three of the non-chemical alternatives – drone brood removal (36 individuals, 20% loss), brood cycle interruptions (27 individuals, 20% loss) and requeening with hygienic stock (18 individuals, 16% loss) have also been the most useful in previous year surveys in reducing winter losses. Painting hives with distinctive colors has resulted in better survival in each of the past five
years, as it did this year (24%). Minimum intervention (35% loss) and small cell/natural comb (42%) showed the worst survival.
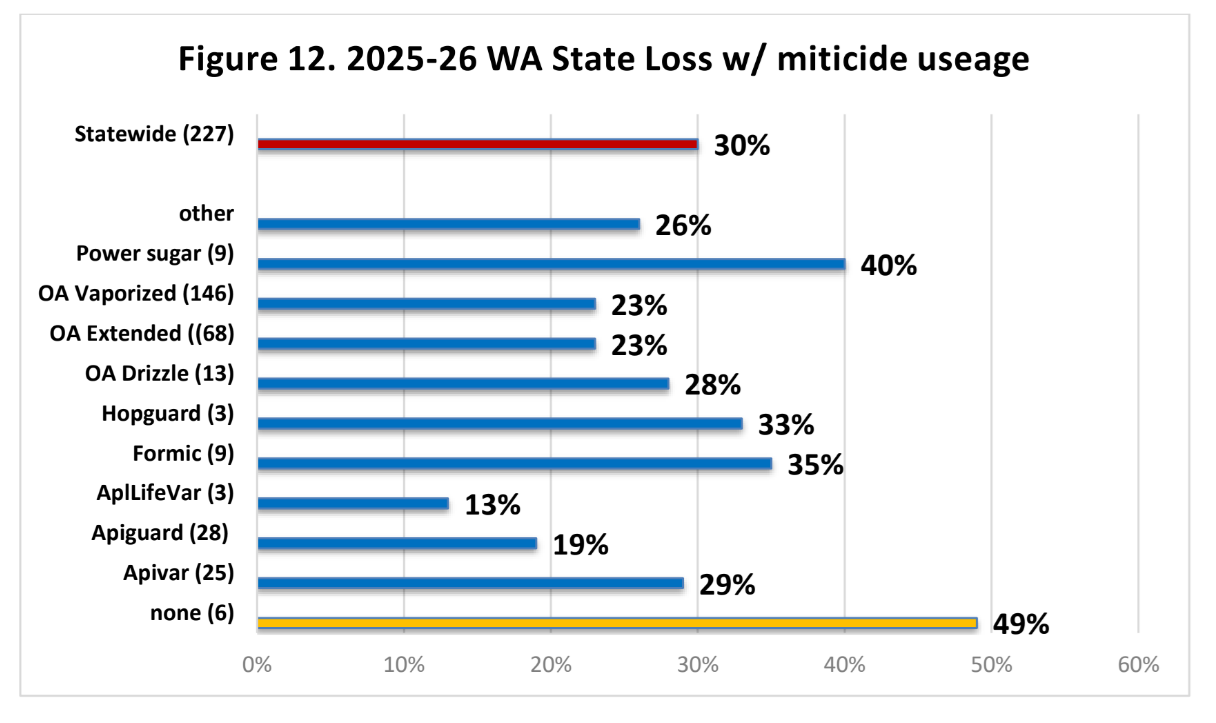
Chemical Control: For mite chemical control, five individuals (3% of total respondents) used NO chemical treatment; these five individuals (53 colonies) had a 59% loss level (the last three years those doing no treatments lost 100%, 61% and 67% but colony number lost (average 8) was not extensive- this year it was a 10 colony average). Those using chemicals used at rate of 1.7 /individual (last year 2.1/individual). Eighty-one individuals (58%) used one chemical and had 32% loss, 57 used two and had a 46.5% loss, 22 used 3 (7% loss), 4 used 4, (8%). Figure 12 illustrates the number of uses ( ) and bar length indicates the loss rate for those using that chemical.
Apivar: One-time users (17 individuals) had a loss rate of 34%, while 7 individuals using it twice the loss rate dropped to 30%. One individual used it three times (7 colonies, no loss). The 25 users of Apivar (15.7% of total respondents using a chemical) had a 28.5% loss. This is a mere 1.4 percentage points better than state average.
Apiguard: The 14 individuals that used it once had 12% loss, the 11 individuals who used it twice had a 39% loss. Two individuals used it three times lost 3 of 45 colonies (6.5% loss), and the one who used it 4 times lost one of 3 colonies (33% loss). The overall loss rate for 28 users of Apiguard (17.5% of users of chemicals) illustrated that it is helpful for survival – overall 19% loss rate, but this was largely due to one individual with large colony numbers and effectiveness of one-time users.
ApiLifeVar: Although there were only 3 individuals who used the essential oil material
ApiLifeVar (all three used it once) their survival rate was outstanding. The 3 had a loss of only 3 of 23 colonies – an 11% loss rate. Other herbals indicated in the other category lost 5 of 14 colonies for a 35% loss.
Hopguard: three individuals used Hopguard, an acid. One used it once and 2 used it twice. Overall loss rate 33%.
Powder sugar: Nine individuals used powder sugar. Their loss was 40%.
Narroa: Two individuals said they used this new dsRNAi product – they had 32% loss.
Oxalic acid. Oxalic acid is being extensively used, and it is proving to be effective in reducing overwintering loss. It can be mixed into sugar syrup and applied as a dribble between frames (often during winter). For convenience it is simply termed OAD. It can be absorbed into a pad and used between brood boxes for an extended time, even when supers are in place (OAE) and finally it may be cooked with a vaporizer and used as gas – OAV. And it may be used many times. NOTE: Oxalic acid in one of the three forms was used by all but 19 Individuals who did not Fast Track.
OAD: Thirteen individuals used OAD. Three used it 3 times with 46.5% loss of fall colonies, three others used it twice for 89% loss and the 17 one-time users had a 175 loss. Overall loss rate= 28% for OAD, mainly from the one-time users.
OAE: Use of Oxalic acid in an extended manner has increased dramatically. Absorbent pads may last 4-6 weeks and then be replaced. Ten users of OAE indicated use 6+ times and lost only 9 of 83 so treated colonies for loss rate of 11%. Two individuals used it 5 times and had a 18.5% loss, the four individuals that used it 4 times for some reason had a heavy 355 loss, five individuals used it 3 times (2% loss), 18 individuals used it twice for 18% loss and 23 individuals used it once for 36% loss The overall loss rate for OAE was 22.5%. The two who indicated using VarroxSan the commercially available OAE, had a 67% loss.
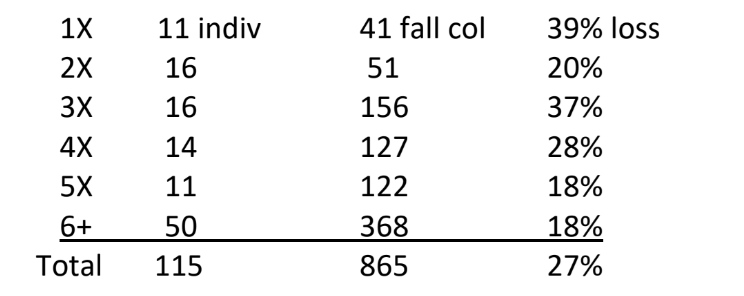
OAV: This chemical mite treatment was by far the most popular, used on 865 colonies (compared to 646 colonies treated with OAE). Both formulations had better than average survival – 22.5% for OAE and 21% for OAV, 7 and 9 percentage point improvements respectively over statewide survival. One hundred and fifteen individuals said they used OAV. The number of individuals, their fall colony number and loss are shown is table below. It is clear that OAV needs repeated use to be effective.
Consistently, the last seven years five different chemicals have helped beekeepers realize better survival. The essential oils Apiguard and ApiLifeVar have consistently demonstrated the lowest loss level; this year 19% and 13% loss. Apivar, the synthetic amitraz, has demonstrated better survival over the past 7 of 8 years but this year by only a single percentage point las year it was 2 percentage points poorer in survival.
Oxalic acid vaporization over the past 6 years has a 14% better survival (the survey did not differentiate Oxalic vaporization from drizzle prior before); this year a 9-percentage point better survival difference. Formic acid use is declining, 9 individuals indicated using it this year, and it seems not to be very effective – a 5-percentage point poorer survival this year.
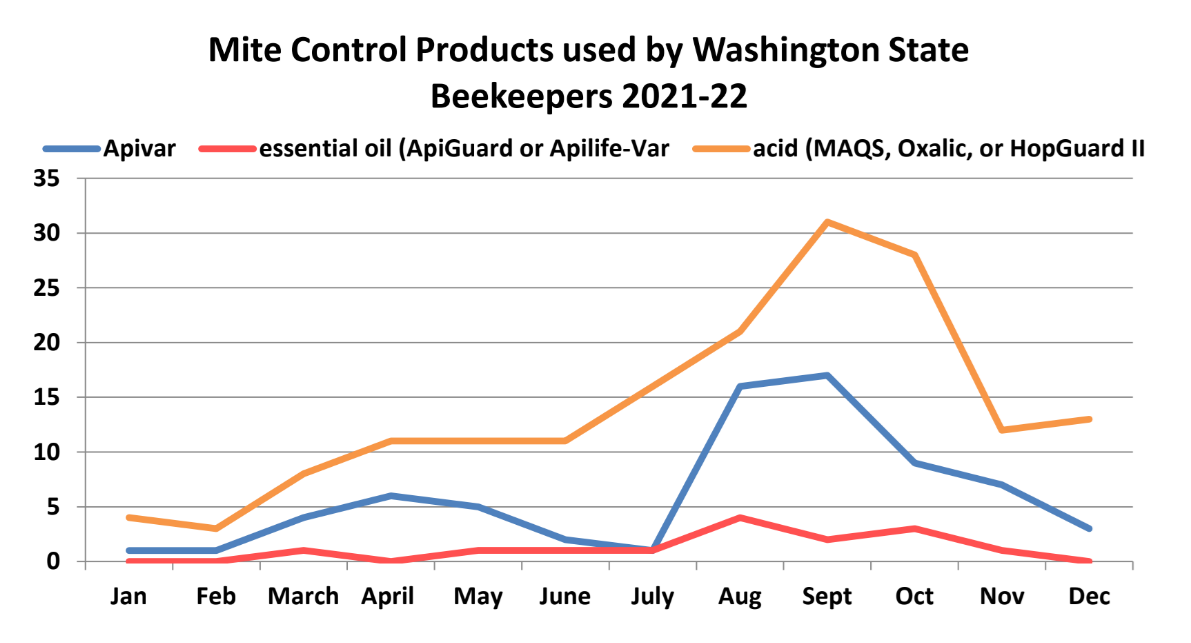
The monthly use of Apivar (blue line), essential oil (red line) or an acid (green line) is shown in Figure 13 for winter of 2021-22. Further review is needed to determine if the timing of treatments was more effective than at other times for the various chemicals.
Antibiotic use
One individual with 32 fall colonies reported using Terramycin; the loss level was 53%. One individual (43 fall colonies) indicated use of Tymol, they had a 53% loss. Four individuals indicated the use of Fumagillin (Fumidil-B) for Nosema control; their loss rate was 10% (40 fall colonies). The four Nosevet users lost only 3 fall colonies of 79 total = 4% loss.
Queens
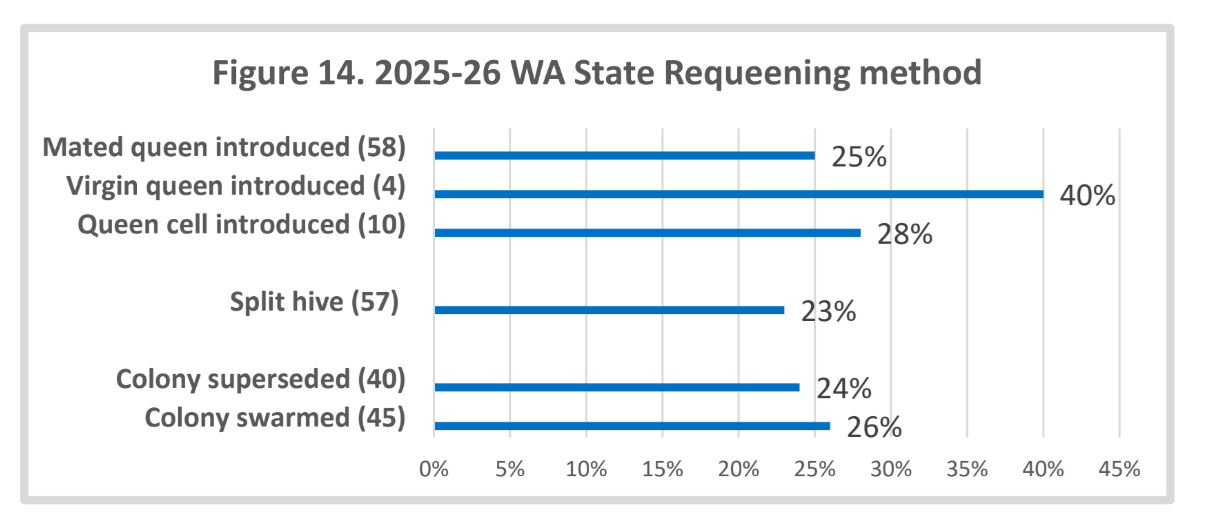
We hear lots of issues related to queen “problems.” Twenty-four percent of individuals indicated queen problems as reason for loss in earlier part of survey (Figure 6). Queen events can be a significant factor contributing to a colony not performing as expected. Seventy individuals FAST Tracked and did not respond to the section on queens; they had loss level of 51%. We asked if you had marked queens in your hives. Eighty individuals said yes (loss level 25%), and 77 individuals said no (loss level 26.5%.) The related question then was ‘were your hives requeened in any form?’ to which 80% (124 individuals) said yes (loss 25%); nearly equal numbers said no or ‘not that that I am aware of.’ Loss level of no was 35%, and 23% for ‘not aware of’ responders. One technique to reduce mite buildup in a colony is to requeen/break the brood cycle. The question “How did bees/you requeen“ received 120 responses, 2/individual (more than one option could be checked). Fifty-eight individuals indicated they requeened with a mated queen, and they had a 24.5% loss level, four used a virgin queen (40% loss) and 10 used a queen cell (27.5% loss).
Fifty-seven said they split their hive(s) 23% loss, 45 indicated their colonies swarmed 25.5% loss and 40 said supersedure occurred – they had a 24% loss. Loss levels of colonies that did it themselves via supersedure and swarming were not very difference compared to those whose queen replacement was managed by the beekeeper via mated queen or queen cell. Splitting hive was slightly lower loss.
Closing comments
I intend to continue to refine this instrument each season and hope you will join in response next march/April. If you would like a reminder when survey is open, please subscribe to the mailing list. I have a blog on the pnwhoneybeesurvey.com and will respond to any questions or concerns you might have. Email me directly for quicker response: dmcaron@udel.edu.
I whole heartedly thank Jenai Fitzpatrick, who has been an invaluable assistant through the years with the data and to Bill Catherall who has been our webmaster for PUB and who has graciously continued with the loss survey. For different reasons, neither individual now keeps honey bees, so for both this is a labor of love. Both say it is payback to those years they had bees and the wonderful friendships developed among the beekeepers.
Thank You to all who participated. If you find any of this information of value, please consider adding your voice to the survey in a subsequent season.
Dewey Caron May 2026