Winter Bee Losses of Oregon Backyard Beekeepers, 2016-2017 by Dewey M. Caron and Jenai Fitzpatrick (View PDF report here)
Overwintering losses of small scale Oregon backyarder beekeepers were elevated in 2016-2017 compared with the previous season. The reason(s) for colony losses is not always obvious as there often are several contributing factors. Herein we review and discuss the data provided by 282 OR smaller-scale beekeepers, in an effort to weigh the loss impact factors. Our desired result is to educate, thereby increasing the sustainability of backyard beekeeping.
This report presents the results of a 9th season of loss surveys of small-scale Oregon (hobbyist) backyard beekeepers and the 3rd season of the expanded digital version. This annual survey is conducted electronically (here) during April and supplemented with paper surveys distributed at several late-March and April local association meetings. In all, 334 valid surveys were returned, 282 from Oregon and 52 from Washington beekeepers.
Section 1: Characterization of survey respondents

Figure 1
Surveys were received from members of 14 local Oregon (OR) associations and several Washington associations. The majority of the OR respondents (199= 70.5%) keep bees in the Willamette Valley of Oregon. Additional surveys were received from 13 Coastal beekeepers, 11 from Tillamook beekeepers, 8 from both Hood River and Klamath Basin beekeepers, 20 from Central OR and 23 from Southern Oregon beekeepers. The majority (38=73%) of Washington responses were from beekeepers in the I-5 corridor Vancouver to Tacoma area. In bar graph, the number in ( ) shows club respondent numbers and percent figure at end of bar the loss level percent of each association.
In this snapshot of our industry, we asked individuals to identify the major source of their beekeeping education. Bee club meetings, including Q & A, were indicated as the selection of greatest value (24%). However choices of Books, journals and magazines (22%) and Online reading and videos (21%) were also highly selected. Bee Mentors (18%) and Master Beekeeping Program (11%)were next. Figure 2 below shows OR beekeeper responses by number of respondents ( ) and % of total. The survey responses this year were similar to last year.

Figure 2
We asked if there was a mentor available for the first years of beekeeping. 65% of OR beekeepers indicated YES. This is encouraging as the learning curve is a steep one for new beekeepers and mentors can significantly help new individuals get through the critical 1st / early years.
To better characterize the respondent population, we asked how many [spring] colonies and how many years of beekeeping experience survey respondents had. The majority of individuals (73.5%) completing a survey had zero (44), 1, or 2 spring colonies, with a range of 0 to 36 colonies; one individual had 48 fall colonies. Medium number of surviving spring colonies =2, average number = 3.1 colonies per individual; 18 individuals (6%) had 10 or more colonies.
The medium years of beekeeping experience was 4 years with 47% of respondents having 1, 2 or 3 years of experience; 38 individuals (13.5%) had ten years or more of experience with 7 individuals listing 35 or more years of experience; the greatest was 50 years. One way to express the measure of beekeeping experience is Hive Years. This number is obtained by multiplying the number of hives by number of years of experience. Together the two speak to greater involvement in bees. The hive years distribution is shown in adjacent Figure. As evident, 60% of our OR respondent population had 10 or fewer Hive Years.
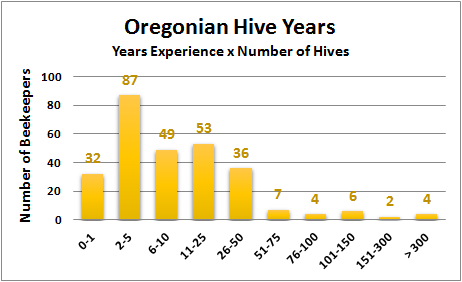
Figure 3
The majority of surveys are being returned by new beekeepers, the same individuals that constitute the majority of active club attendees.
Section 2: 2015-2016 Overwinter losses (based on hive type)
The loss statistic was developed by asking number of fall colonies and number in the spring by hive type. Total OR backyard beekeeper overwinter loss = 48%. Results are shown in bar graph of Figure 4. Number of fall (1318 colonies) and spring hives (683 surviving colonies) are shown by hive types. Fifty five individuals (19.5%) maintained more than one hive type.
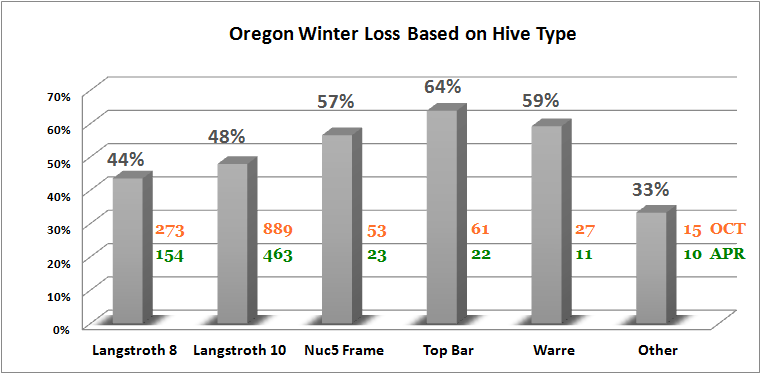
Figure 4
The 44% winter losses of PNW 8-frame Langstroth hives, was 4 percentage points lower than the 48% loss rate of 10-frame Langstroth hives, but not statistically different. Two years ago both 8 and 10-frame Langstroth hives had a 27% loss rate while last year, 8 frame Langstroth hives had a 8 percentage point lower loss (35% for 8 frame Langstroth vs 44% for 10 frame Langstroth hives; over the past three years there was no statistical difference in 2 of 3 years. Nuc (5-frame) hive loss, top bar hive and Warré losses all were higher (range 57 to 64% but with lower total numbers not statistically different). Of the 15 “other” hive types, 10 were long hives (1 didn’t survive), 2 flow, 2 mini-hives and 1 was a feral log hive.
The 52 Washington beekeepers, entering the fall with 188 colonies had a slightly higher loss rate of 55%. Last year the difference was more pronounced; 219 OR beekeepers had 40% loss rate while 52 Washington beekeepers had a 60% loss rate. The reason(s) for higher losses by Washington beekeepers the past two years are unknown but the lower number of Washington respondents compared to Oregon could be partly responsible. Small numbers, such as with individual clubs, are more difficult to interpret and are not as reliable since one or two returns can skew results.
Thirty-four percent (34%) of OR respondents (97 individuals) had NO LOSS overwinter, whereas 20.5% (58 individuals) lost 100% of fall colonies. Forty one percent (41%) of respondents lost 1 or 2 colonies (115 individuals), 17% lost 3 to 6 colonies, 2.5% lost 7 to 12 colonies and 3% (9 individuals) lost 13 or more colonies; heaviest loss was 28 colonies. The greatest numerical loss was one colony. Figure 5 shows this data. Numbers are reflective of the fact that backyarders keep on average 3.1 colonies, although some have more colonies.
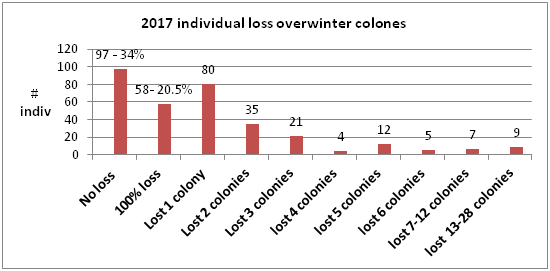
Figure 5
Section 3: Loss rates at different locations
We asked loss related to location of the hive. Eighty-four percent of respondents kept bees at a single location. Of those 39 individuals who had multiple locations, an additional 7% had more than 2 apiaries; up to 5 apiary locations were reported for one individual. Loss numbers were highest for the 1st apiary site (48%); there were slightly lower losses of 43% at 2nd apiary site for the 39 individuals listing a 2nd site. Information supplied on location will be used to develop location maps similar to maps prepared by Jenai in 2014.
Overwinter losses of members of different organizations are shown in the Figure 1 above. The loss rates varied from a low of 34% for the 13 Coastal respondents to a high of 70% in Linn Benton Association. The range of losses, 34 to 70%, is a 2 fold difference; last year the range was 20% for LBBA to 80% for Klamath Basin, a 4-fold difference. Bar length of Figure 1 is expression of percent loss.
Forty individuals (14%) moved colonies during the year. Reasons listed for move included 14 individuals who moved anywhere from a few yards to 30+ miles for a better apiary location. Seeking a sunnier location, a location to reduce yellow jacket predation or a move for better honey production were indicated. Five individuals said they moved due to neighbor conflict/allergy situation (including in one case a pet) and to be further from a school. Half that number (7 individuals) moved their bees for pollination, including for almonds, peaches, cherries and blackberries. Six individuals moved or changed location so their bees were moved. Other reasons listed were to gift a friend or to provide new apiary for bees that were purchased.
The 2017 Bee Informed national survey (4,900+ respondents, 96% backyarders) reported national overwinter losses of 21.1%, the lowest level in our 11 years of conducting this national survey. There were 169 OR Beekeepers who participated; their overwinter loss was 20.5%.
Comparison to larger-scale beekeeper losses
A different (paper) survey instrument was mailed to Pacific Northwest (PNW) semi-commercial (50-500 colonies) and commercial beekeepers (500+) asking about their overwintering losses. Fourteen Oregon commercial and six semi-commercial beekeepers (42,166 colonies, approximately 57% of the estimated total number of colonies in the state) reported overwinter losses were 25%. This is nearly 37% greater compared to the level of the previous winter (15.7%) and twice as high as the 2014-2015 loss level of 12.4%. Comparisons of last 3 years are shown in Figure 6.
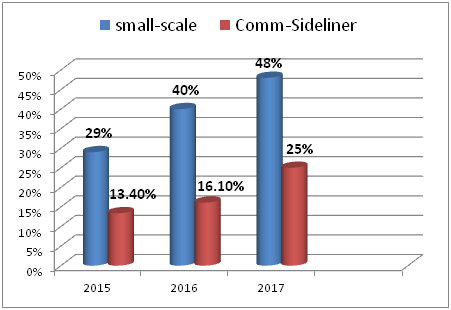
Figure 6
Backyard losses, virtually double the losses of larger-scale beekeepers, have consistently been higher over 7 years of survey responses. Commercial and semi-commercial beekeepers take losses in the fall and are more pro-active in varroa mite control management.
Section 4: Survival based on hive origination
We also asked survey respondents to characterize their loss by hive origination. The result is graphically presented below in Figure 7. There was relatively little difference but as expected overwintered colonies had the best survival and packages did the poorest with about a 1/3rd difference;

Figure 7
last year figures were essentially the same (31% vs 59%). Nucs (44%) did nearly as well as overwintered colonies both year (36% loss rate last year.) Split/divides, swarm captures and feral hive transfer losses were over 50%.
Section 9: Colony Death perceived reason and acceptable level
We asked PNW individuals that had colony loss (recall 34% had NO LOSS) for their expression of what might have been the reason for their loss. More than one option was allowed for those with multiple losses. Most common responses were Varroa mites and Poor Wintering conditions, followed closely by Weak in the Fall then Queen failure and Starvation. Yellow jackets (6%), CCD (Colony Collapse Disorder) 3%, a general loss symptom whereby the adults die away from their hive, Pesticides (2%) and Nosema followed in that order. One individual listed the disease American Foubrood. Under “other,” 3 individuals said absconding hive, 2 PMS, 2 to possibly “other” pathogens. One colony was loss due to a falling tree. There is no easy way to verify reason(s) for colony loss. Colonies in the same apiary may die for different reasons. Doing the forensics is the first step in seeking to solve the heavy loss problem. More attention to colony strength and possibility of mitigating winter starvation will help reduce some of the losses. Effectively controlling varroa mites will definitely help reduce losses.
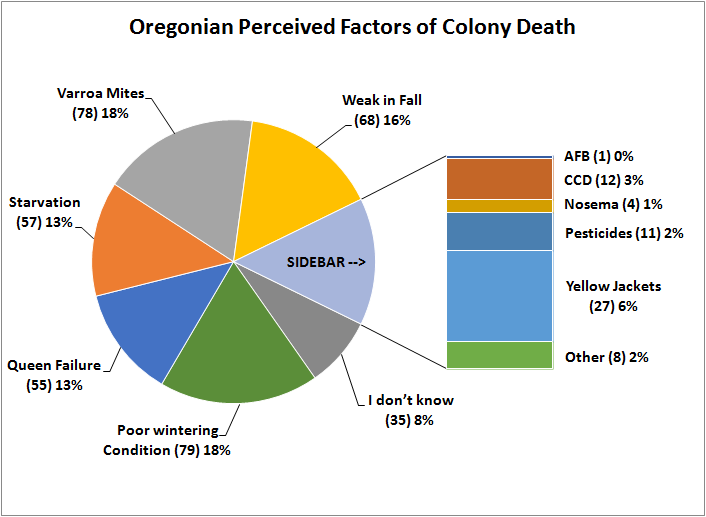
Figure 8
Acceptable loss: Respondents were asked to select an acceptable loss level, being offered several categories to check. Seventy-one individuals (35.5%) said zero, 30.5% said to 10% and 83 individuals (41.5%) indicated up to 25% was acceptable. Seven individuals said 75 or 100% was acceptable Nationally the Bee Informed survey response to the same question has been between 15 and 19%: this past year it was 15%. Data shown in Figure 9.

Figure 9
Why do colonies die? There appears to be no single reason for loss and a good deal of variance in opinion as to what might be an acceptable loss level. There is nobody to come check why a dead colony died. Close examination may eliminate some possible factors but we are still often left with more than one “likely” cause of death. Nationally the BIP data base indicates that about 1/3 of individuals have no loss or very low losses, about a 1/3 have losses around the average figures for the year while the 1/3rd with heaviest losses tend to be individuals who are not doing, or perhaps not properly doing, varroa mite control.
We are dealing with living animals which are constantly exposed to many different challenges, both in the natural environment and the beekeeper’s apiary. The four major factors in colony loss are thought to be mites, pesticides, declining nutrition adequacy of the environment and diseases, especially viruses and Nosema. Management, failure to do something or doing things incorrectly, remains a factor in our losses as does alteration to the bee’s natural environment.
Langstroth wrote about the importance of taking losses in fall management saying if the beekeeper neglects such attention to his/her colonies, 45% loss levels may occur, depending upon variable environmental conditions. It can be argued that losses of 30, 40, 50% or more might be “normal.” Older, more experienced beekeepers recall when loss levels were 15% or less. Honey production fluctuates each year but, once again, seems to be declining on average. Numbers of U.S. bee colonies have declined steadily since the 1940s, returning to numbers of 100 years ago, but worldwide numbers of bee colonies are steadily increasing.
There is no simple answer to explain the levels of current losses nor is it possible to demonstrate that they are excessive for all the issues facing honey bees in the current environment.
Section 5: General hive practices
We asked in the survey for information about some managements practiced by respondents. Multiple responses were possible.
FEEDINGS: The numbers of PNW beekeeper feeding responses (697 total) are shown in bar graph Figure 10. Number following practice is number of individuals who indicated each item and percent to right the rate of use. Eighteen (18) individuals (10%) managing Langstroth hives did not do any of the options offered; they had a 75% loss of colonies (compared to 48% overall losses); 5 top bar hive owners who indicated doing no feedings lost 81% and 2 Warré hive owners who checked no feedings lost all of their Warré hives.
Feeding sugar syrup (222 individuals, 32%), feeding frames of honey (117 respondents 17%) and feeding pollen patties (115 individuals, 16.5%) were the most common feeding managements. Most individuals (83%) checked more than one feeding activity; 70% of the 33 individuals reporting a single choice checked sugar syrup, followed by honey (10 individuals, 21%). The number checking 2 choices = 73, 78 checked 3 and 68 checked 4 or more; largest number was 7.
Of those who indicated feeding of pollen (17 individuals fed pollen dry, 152 pollen patties and 15 frames of pollen) the combined loss rate for 8 and 10 frame Langstroth hives + 5 frame nucs was 41%, below overall loss rate of 48%. The 17 individuals feeding dry pollen had the lowest loss.
One hundred three (103) respondents reported feeding frames of honey and 14 said they fed liquid honey. Loss rates were however not different from overall rates; those feeding honey in either manner had a 50% loss rate, not significantly different form the overall 2017 loss rate of 48%. Two hundred twenty-two individuals fed sugar syrup to their colonies. Overall losses were 47%, again not statistically different from the overall loss rate of 48%. Two hundred twenty two individuals reported feeding sugar syrup.
There were 4 choices for feeding of sugar other than as a liquid. Ten individuals checked feeding of fondant, 42 individuals checked drivert, 60 said they fed dry sugar and 62 hard candy + one fed a slush. Overall loss of the individuals doing these types of feedings was 44% compared to 48% overall loss; apparently collectively these helped reduce losses. Feeding dry sugar showed improvement (40% loss) and providing hard candy had the best results with only a 39% loss rate. Feeding hard candy, dry sugar or fondant is preferred during the rainy months so as not to add additional moisture stress to PNW colonies.
Results indicate a high level of feeding management of both sugars and supplemental protein. Sixty one percent of individuals did more than one thing, 28% checked two items and 34% did 3 or more including one individual who selected 7 different choices.
It appears feeding protein, dry pollen or pollen patties improves survivorship. Also feeding dry sugar or a sugar candy improves survivorship. Feeding can make for better overwinter survival.
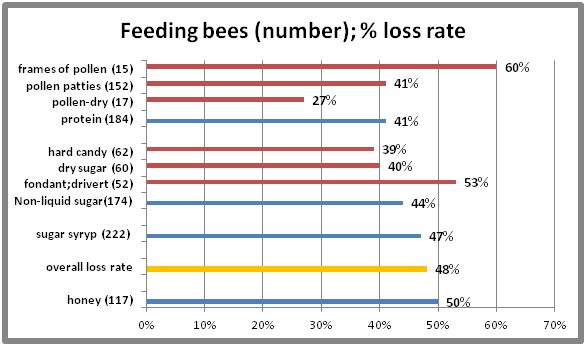
Figure 10
WINTERING PRACTICES: We received 538 responses about OR beekeeper wintering management practices (more than one option could be chosen). Forty-six individuals (17.5%) percent of the respondents indicated none of the several listed wintering practices was done; these individuals had a 49.5% winter loss compared to overall of 48%. In all, 538 choices were checked by survey respondents ; 66 did one single thing, 69 did 2, 53 did three and 42 did 4 or more, up to 7 managements by one respondent.
The most common wintering management selected (133 individuals) was ventilation/use of a quilt box at colony top followed by rain shelter (101 individuals). Figure 11 shows number of individual choices and percent of each selection. Among the 10 “other” responses were use of screen bottom board or slatted rack, checking winter stores, adding candy board, combining hives, adding other insulation and removal of extra boxes/equipment.
Use of rain shelter (103individuals) did not improve winter survival (48% loss, same as total OR backyarders). The 133 individuals who used the ventilating quilt on top of the colony (30 individuals did ONLY this wintering practice) had a 45% loss, compared to 48% overall indicating such a device might offer a small survival advantage. Combining an upper entrance, insulation at top and a ventilation board (alone or in combinations with other managements) did mean a slightly lower 44.5% winter loss rate. The variety of choices of these wintering selections and all of these “other” managements demonstrate that backyard beekeepers are taking extra measures to help colonies survive winter conditions. Data analysis did not demonstrate that other winter managements reduced winter losses.
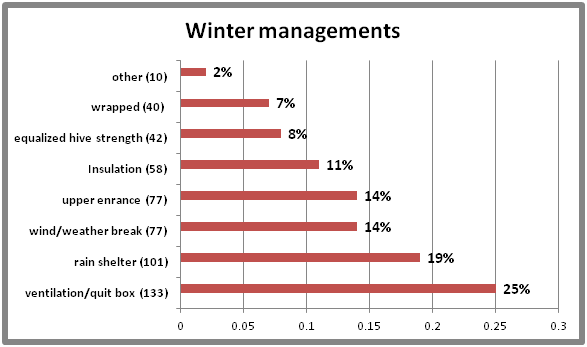
Figure 11
SANITATION PRACTICES: It is critical that we practice some basic sanitation (some prefer use of term bee biosecurity) in our bee care. We can do more basic sanitary practices to help insure healthy bees. We received 512 responses for this survey question. Eighteen percent (51 individuals) said they did not practice any of the 6 offered alternatives; they had a loss rate of 46% compared to overall rate of 48% Minimal hive intervention (138 individuals was the most common option selected. It could be argued that less intervention might mean reduced opportunity to compromise bee sanitation efforts of the bees themselves and that excessive inspections/ manipulations can potentially interfere with what the bees are doing to stay healthy. This option however did not improve winter survival, the loss rate for this group was 51%.
The singular hive sanitation that helped improve survival was providing hives with distinctive ID /doing other hive ID measures; loss rate of this option was 45%. Among “other” alternatives listed were ventilating bottom boards, moisture removal and keeping colonies healthy. See Figure 12.
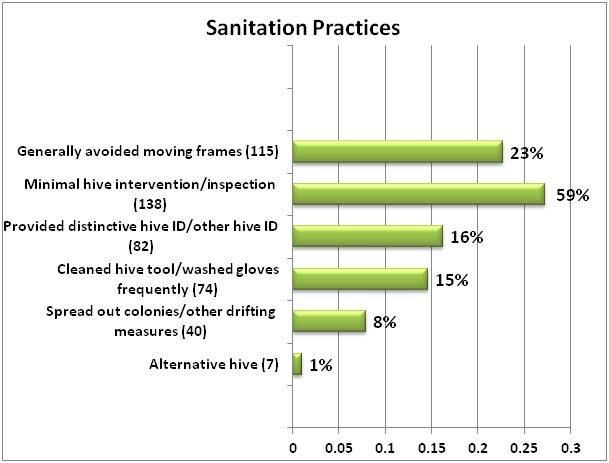
Figure 12
SCREEN BOTTOM BOARDS: In our previous survey years 17% of PNW beekeepers said they did not use screened bottom boards; 18% (50 individuals) said they did not use them this past year. For those using SBB, 83.5%(194 individuals) used them on all their hives and 16% used a screen bottom board on some of their hives. As shown in Figure 13, 46% leave the boards open over the winter period (never response). A third blocked them or closed them during winter. Of the 50 individuals not using a SBB, their winter loss rate was 58% and for those using them on 100% of their colonies the reported loss rate was 45%.
There is no good science on whether open or closed bottoms make a difference in overwinter but some beekeepers “feel” bees do better with it closed overwinter. An open bottom, at least part of the year, can assist the bees in keeping their hive cleaner. When use of screen bottoms was compared to
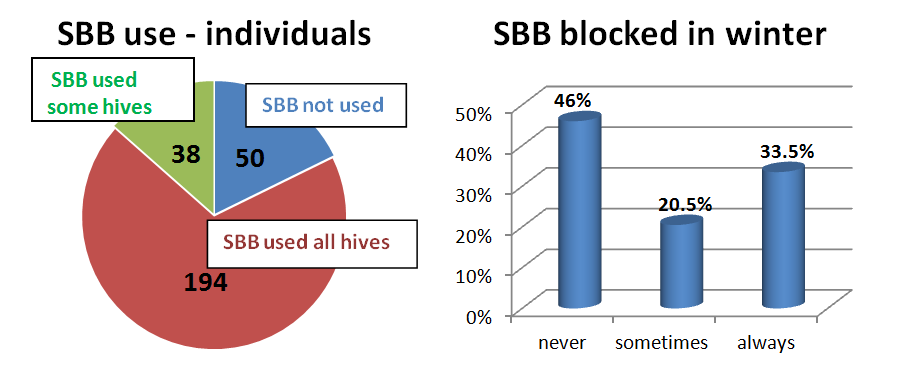
Figure 13
non-use, there was a 5 pecentage point difference in improved survival overwinter last year (271 PNW beekeeper respondents) and a 12.5 difference this year. It does appear there may be a slight advantage to use of screen bottoms (see 2015 report here).
Things that seem to improve winter success: It should be emphasized that these comparisons are correlations not causation. They are single comparisons of one item with loss numbers. Individual beekeepers do not do only one management option nor do they necessarily do the same thing to all the colonies in their care. We do know moisture kills bees, not cold, so we recommend hives be located out of the wind, in the sun, and, when exposed, providing some extra wind/weather protection might improve survival. Leave screened bottom boards open and insure top ventilation. Use of insulted tops/quilt box with moisture collector such as burlap, straw, old towels, etc with extra top ventilation to vent the moisture is also a good idea. Feed bees either sugar syrup or honey from other hives to insure enough food stores in fall management. Once fall rains start, halt syrup feeding and switch to feed dry sugar or a hard candy to avoid adding additional moisture stress to colonies. Finally, it would seem prudent to review basic sanitation measures as anything we can do to help reduce sick bees and improve colony health will improve overall survival.
Section 6: Mite monitoring/sampling and control management
We asked percentage of OR hives monitored for mites during the 2016 year and/or overwinter, whether sampling was pre- or post-treatment or both and, of the 5 possible mite sampling methods, what method was used and when it was employed. 178 individual respondents (63%) said they monitored all their hives and when those individuals monitoring was compared to loss, this group had a 43% loss. 62 (22%) reported no monitoring and when compared to loss had the statewide average loss of 48% loss. 43 individuals reported monitoring some of their colonies; they had a 60% loss. See Figure 14.
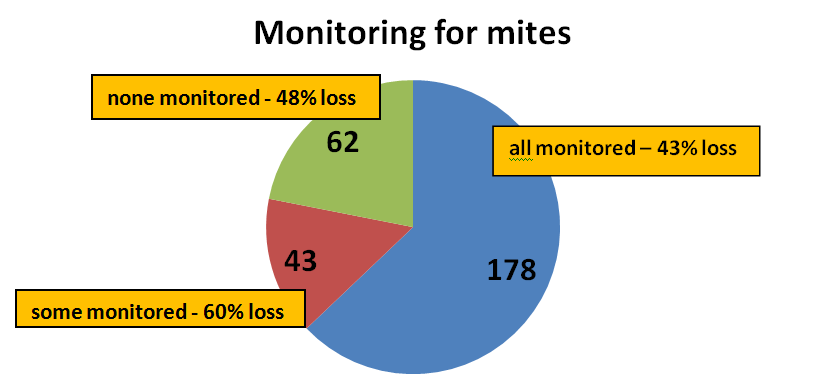
Figure 14
In order of popularity of use, Sticky boards were used by 27%, down from the previous 2 years followed by 95 individuals using powdered sugar monitoring (21%), up from 19% the previous year. Visual inspection of
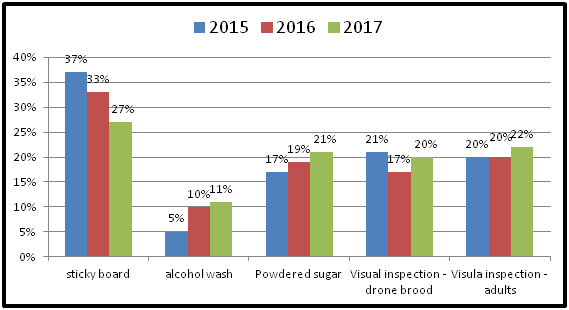
Figure 15
drone brood (88 individuals=20%) and visual inspection of adult bees (95 individuals=22%) were little changed from precious years. When compared to losses the two most effective mite monitoring methods (i.e. losses below the 48% overall level) were Alcohol wash (42% loss level) and powdered sugar, a 44% loss rate.
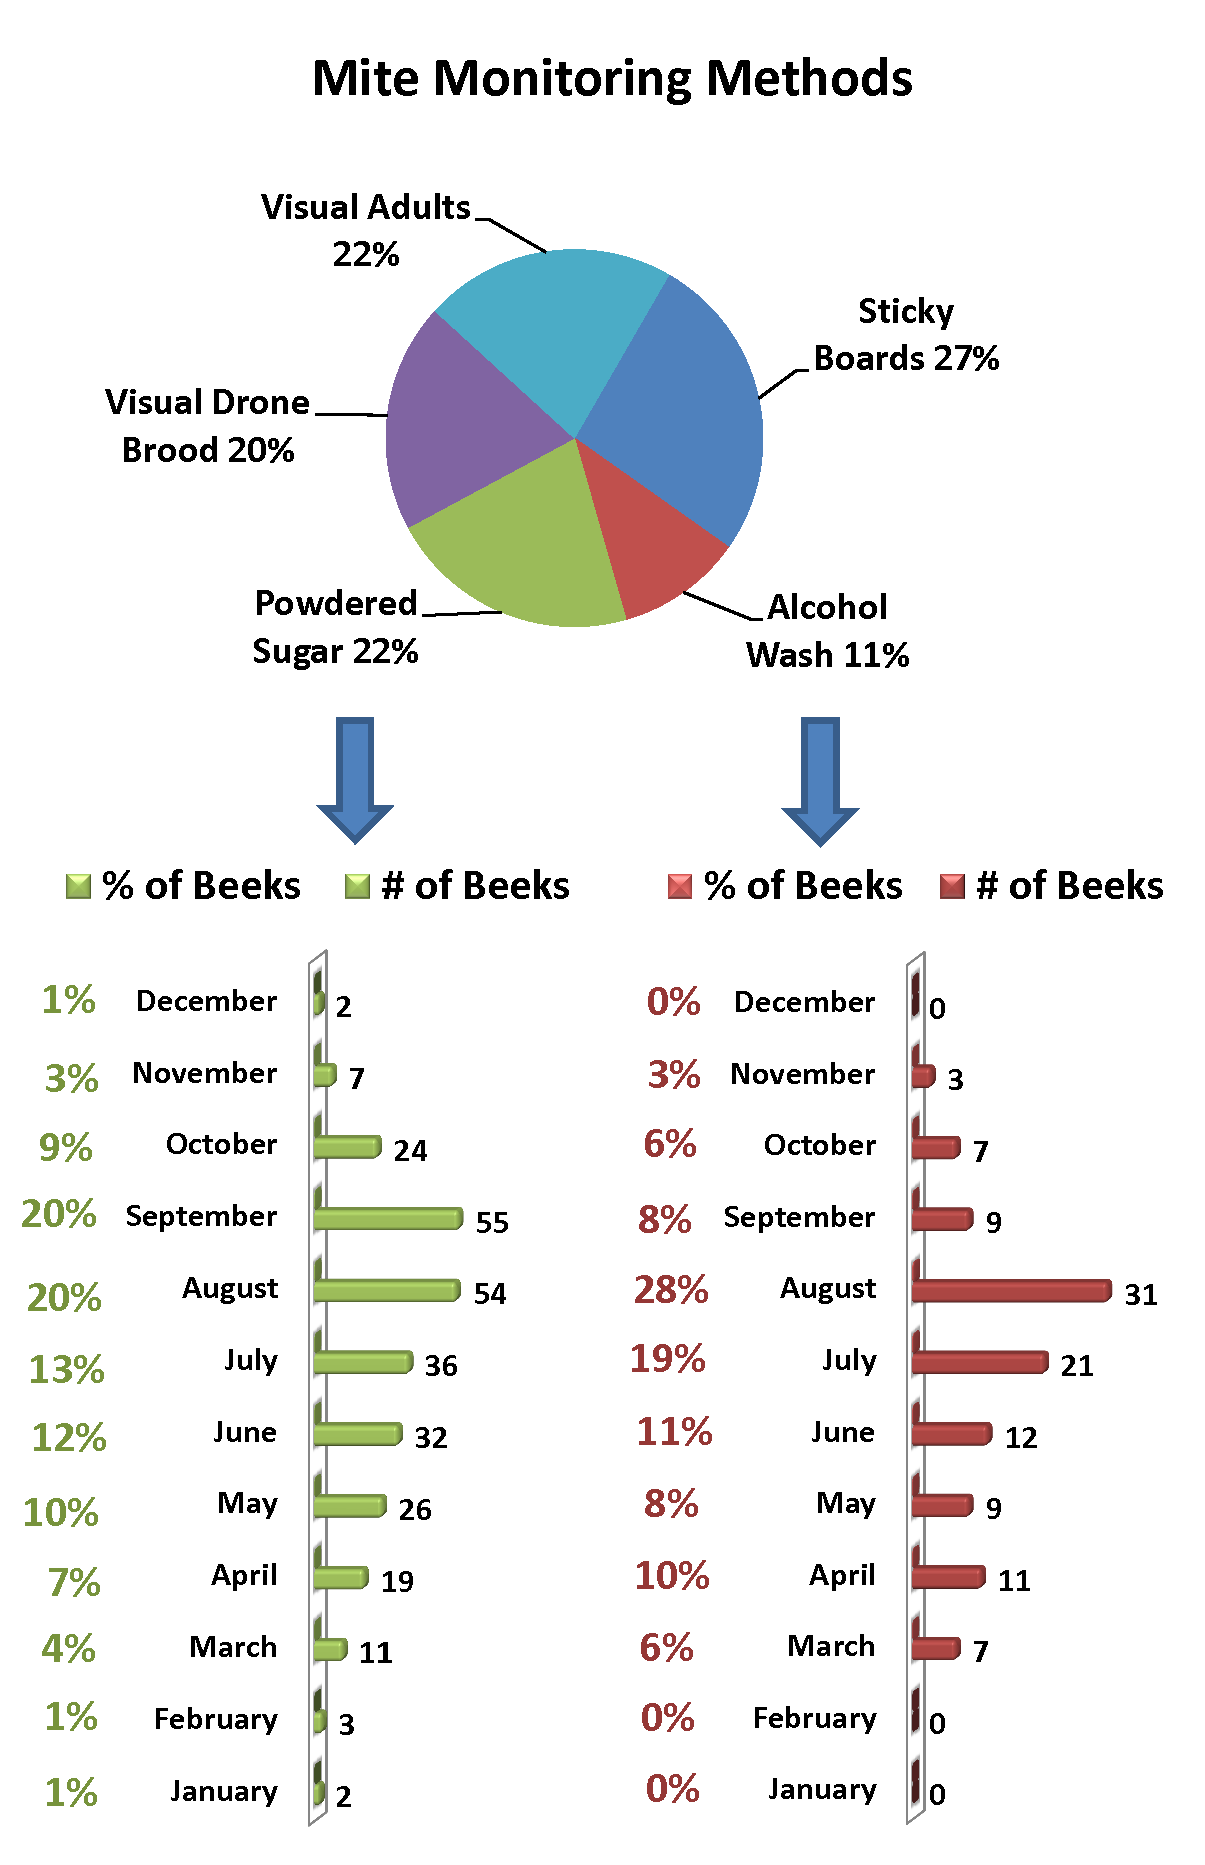
Figure 16
About 30% of individuals monitoring use more than one method. Powdered sugar shake and alcohol wash are both increasingly used; they are the preferred monitoring methods that best estimates the size of the mite population. Sticky boards are useful to check the treatment efficacy when used post treatment. Most sampling to monitor mites was done in July – September, as might be expected since mite numbers change most quickly during these months and results of sampling can most readily be used for control decisions. See Figure16 for sampling months using alcohol (left column) and powdered sugar (right column).
The most common sampling of respondents was both pre and post-treatment (34%) followed by pre-treatment sampling (23%). The data on these selections, including not sampling/not treated (9%), sampled but not treated (18%) and treated but not sampled (12%) is shown in Figure 17.

Figure 17
It is important to KNOW mite numbers. Less effective mite monitoring methods include sticky (detritus) boards below the colony (often so much detritus drops onto a sticky board that picking out the mites can be hard, especially for new beekeepers). Visual sampling is not accurate: most mites are not on the adult bees, but in the brood. Even looking at drone brood is not effective; if done, look at what percentage of drone cells had mites.
See Tools for Varroa Monitoring Guide on the Honey Bee Health Coalition website for a description of, and videos demonstrating, how best to do sugar shake or alcohol wash sampling. The Tools guide also includes suggested mite level to use to base control decisions based on the adult bee sampling. A colony is holding its own against mites if the mite sample is below 2% in spring (i.e. 2 mites/100 adult bees) and below 5% (no more than 5 mites to 100 adults) when at its largest size during nectar flow following buildup. It is critical to not allow mite levels to exceed 2-3% during the fall months when bees are rearing the fat fall bees that will overwinter. It is also the most difficult time to select a control method (if one is deemed needed) as potential treatment harm may negatively impact the colony. We are seeing more colonies suddenly disappear (abscond?) during the fall, which may be related to the treatment itself.
Section 7: Mite control treatments
We asked about non-chemical mite treatments and also about use of chemicals for mite control. Twelve percent (35 individuals) said they did not employ a non-chemical mite control and 83 individuals (29%) did not use a chemical control. See Figure 18. Those who did not use a non-chemical treatment reported a 40% winter loss, a lower loss rate than those who did use a non-chemical control. This paradox is explained perhaps by individuals relying too heavily on those control techniques. In contrast those who did not use a chemical had a 61% loss rate while collectively those who used a chemical control had a XX loss rate. The individual options are discussed below. Clearly varroa mite control can make a difference.
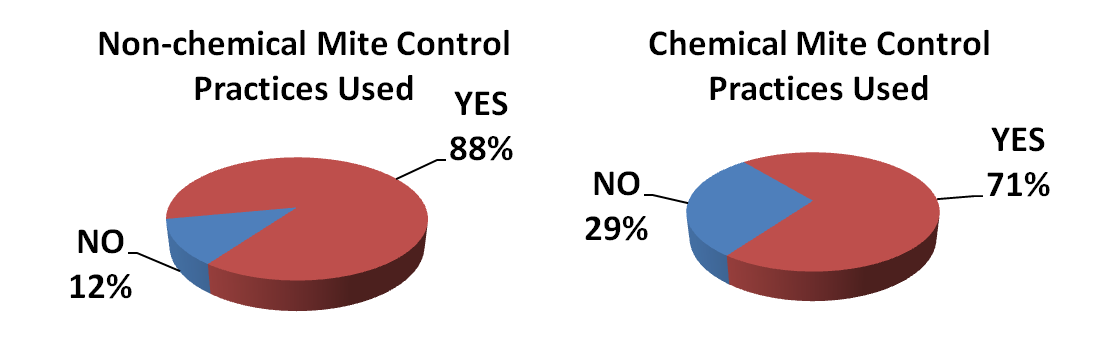
Figure 18
Non-Chemical Mite Control: Of nine non-chemical alternatives offered on the survey use of screened bottom board was listed by 200 individuals. They may offer a slight advantage in lower losses (46%). The next most common selection was minimal hive inspection. The remaining 7 selections are shown in Figure 19. Under other, 5 individuals listed allowing bees to swarm. Although doing nothing resulted in higher survivorship, none of the alternatives was, by itself, especially helpful and small cell/natural comb may have increased losses, both this and last year.
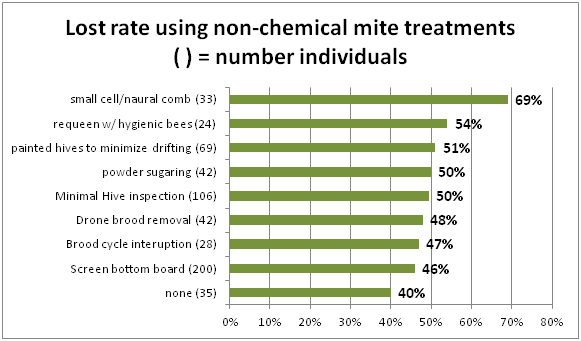
Figure 19
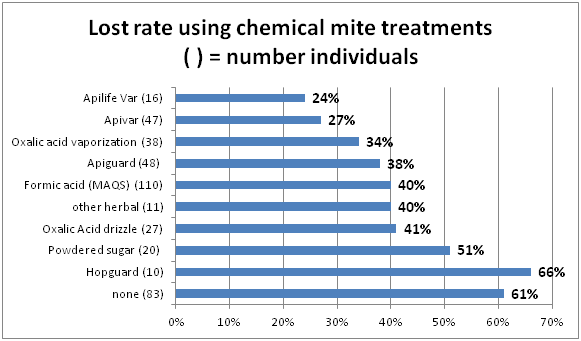
Figure 20
Chemical Control: For mite chemical control, 110 OR Beekeepers (35% of total chemical uses) indicated they most commonly utilized MAQS, formic acid, followed distantly by Apiguard (essential oil thymol, indicated by 15%). Oxalic acid vaporization (utilized by 38 individuals and oxalic acid drizzle (27 individuals) was also commonly used. Apivar (amitraz) use was indicated by 47 individuals. Figure 20 illustrates number of uses ( ) and bar length indicates the loss rate for those using that chemical. Apilife Var, although used by only 16 individuals had the lowest loss rate of 24% overwintering colonies, ½ the average loss. Apivar also had a low loss rate by users (27% loss this year, 23% los rate last year).
Under other, 1 individual listed use of Apistan, 2 listed mineral oil (50% loss), one listed coconut oil/sugar (no loss, but Apivar also used) and 4 indicated grease or oil for tracheal mite control. 88 individuals (52%) indicated use of a single compound, 29% used two, 15% used three and only 7 individuals (5%) used 4 chemicals. Compared with last year, use of oxalic acid (4% last year) has increased (20% both methods combined), and MAQS, last yer 21% and 35% this year. Use of Apivar was at same level as last year (15%).
The monthly use of Apivar (blue line), essential oil (red line) or an acid (green line is shown in Figure 21. Further review is needed to determine if some of the timing was more effective than at other times for the various chemicals.

Figure 21
Twelve individuals (4%) used Fumigillan (for Nosema control); their loss rate was 52%. Three individuals indicated use of terramycin and 2 of tea tree oil.
Section 8: Queens
We hear lots of issues related to queen “problems”. Recall under the questions asking the reasons why colonies didn’t survive that 55 individuals (13%) chose queen failure as one of their selections. On Section 8 of the survey we asked what percentage of loss could be attributed to queen problems. The data is shown in pie chart Figure 22. 42% (118 individuals said none and an additional 70 individuals (25.5%) said they didn’t know. Of those 185 individuals (over double the number that chose to indicate this was a possible reason for winter loss in the other question) almost 3/4rds (74%) said queen failure could have been responsible for 10-30% of their loss; 12% said I might have been responsible for 75-100% of their loses. over 70% (74%) said none or I don’t know (24%). Number of individuals, in ( ), and percentage of estimate of loss rate is shown in Figure 22.
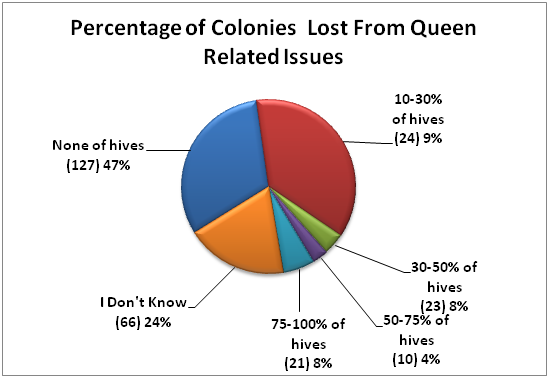
Figure 22
Queen events can be a significant factor contributing to a colony not performing as expected. We asked if you had marked queens in your hives. Seventy-four (74%) said no while y4 individuals 26% said yes. The related question then was did you or your bees replace their colony queen? Forty-nine percent (137 individuals) said yes, 34% said no and the remainder was ‘no. that that I am aware of.’

Figure 23
One technique to reduce mite buildup in a colony is to requeen/break the brood cycle. he question “How did bees/you requeen“ received 137 responses as illustrated in Figure 24. Over half of respondents indicated their bees were requeened with a mated queen. Bees did their own requeening equally via swarming and supersedure (15% each). Other responses are shown in Figure 24.

Figure 24
Closing comments
This survey is designed to ‘ground truth’ the larger, national Bee Informed loss survey. Some similar information is additionally available on the BeeInformed website www.beeinformed.org and individuals are encouraged to examine that data base as well. Reports for individual bee groups are customized. As they are completed they will be posted here by the name of the group.
We intend to continue to refine this instrument each season and hope you will join in response next April. We have a blog and will respond to any questions or concerns you might have.
Thank You to all who participated. If you find any of this information of value please consider adding your voice to the survey in a subsequent season.
Dewey Caron and Jenai Fitzpatrick, June 2017