** Looking for a report in your specific region? Refer to the Individual Club Reports page.
** Scroll down to see the Washington Backyard Beekeepers Winter Bee Loss Report, 2023-24 or click here to view Washington as PDF.
Winter Bee Losses of Oregon Backyard Beekeepers for 2023-2024
by Dewey M. Caron
Click here to view a PDF of Oregon report.
Overwintering losses of small-scale Oregon backyard beekeepers decreased dramatically to 20% this winter, the lowest percentage loss in 15 years of Oregon hobbyist/backyard beekeeper surveys. This annual survey: www.pnwhoneybeesurvey.com. Herein we discuss the data provided by 171 Oregon beekeepers, only 2/3rds of the number last year and well below the previous 5-year average of 305 respondents. Results of the 121 Washington respondents completing surveys (the average response rate of the last few years) are included in a separate loss report. Washington’s average loss was 31%, also the lowest ever reported.
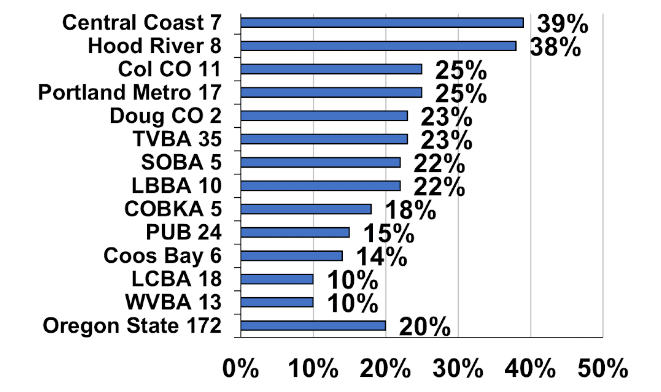
2023 -24 State/Club Losses
Club results of 13 local Oregon associations are shown in Figure 1. Colony numbers ranged from 1 to 41 colonies in Oregon (average 5.7 colonies same as last year; medium number = 4 colonies, also same as last year). The number of respondent individuals are listed next to the association name. The bar length is the average club loss percentage for the year.
Overwinter losses of members of different organizations varied from a low of 10% for the 31 Willamette Valley and Lane Co beekeeper respondents to a high of 39% for the 7 Central Coast members. The 4X range of losses was the same as two years but less than the previous year (3X difference). Approximately 80% of respondents are roughly along the I-5 corridor between California and Washington.
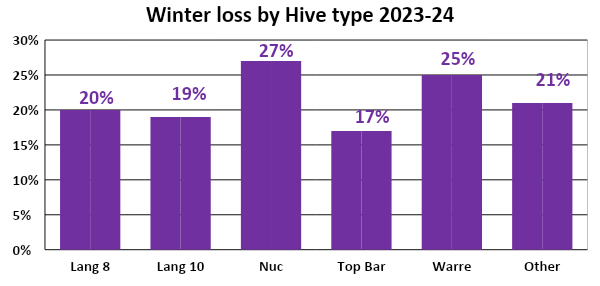
2023-2024 Overwinter Losses by Hive Type
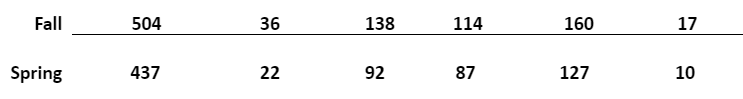
The loss statistic was developed by asking the number of fall colonies and surviving number in the spring by hive type. Respondents had 988 fall hives (345 fewer of the respondent number last year) of which 788 survived to spring (200 lost), equating to a 20% loss (80% survival rate). This was 10 percentage points greater survival over the previous winter loss rate. Ninety-seven percent of hives were 8-frame or 10-frame Langstroth hives, nucs or (49) long hives. There were 49 fall nucs (27% loss rate). Among non-traditional hive types were 24 top bar hives (17% loss) and 12 Warré hives (25% loss). Other hive types in addition to long hives included Layens, log, Apamaye, pagoda and Slovenian.
The winter losses of PNW 8-frame Langstroth hives was a single percentage point greater compared to the loss rate of 10-frame Langstroth hives. The loss rates of Langstroth 8 and 10 frame hives over the past 8 years has averaged 36% for 8-frame Langstroth hives and 40% loss for 10-frame hives respectively but the last 2 years the losses have been within a single percentage point of each other. Nuc losses are typically higher than losses of 8 or 10-frame Langstroth hives, this year 7 percentages point greater. The Nuc 9-year average loss is 43%. This year’s Top Bar hive loss of four colonies (17%) is below the 9-year average top bar hive loss of 48%. The 2023 Warré hive loss rate of 25% is below the 8-year average of 41%.

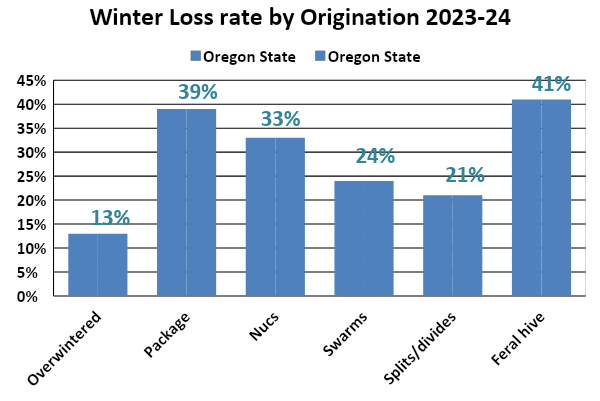
2023-2024 Loses Based on Hive Origination
We also asked survey respondents to characterize their loss by hive origination. The result is graphically presented below. Overwintered colonies obviously had the best survival (13%) with the 160 splits/divides and 1114 swarms also with excellent survival. Packages (39% loss) and nucs (33%) were higher with package bee survivals exhibiting triple the loss rate of the overwintered colonies. The origination loss percentages are relatively the same each year. This season overwintered colonies had a survival rate much better than most winters.
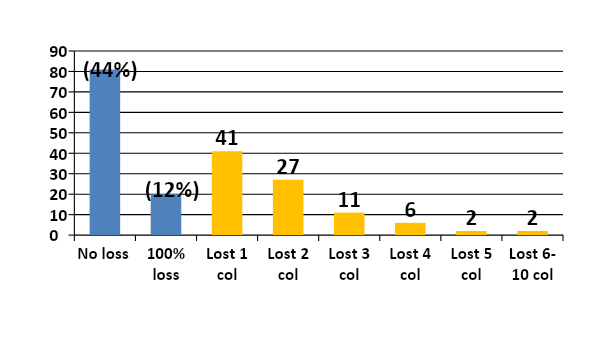
2023 -24 Individual Hive Losses
Forty-seven percent (81 individuals) of Oregon respondents had NO LOSS overwinter (total of 366 colonies), an increase of 11 1/2 percentage points compared to last year. One quarter of that number, 12% (20 individuals – 40 colonies) lost 100% of fall colonies. Figure 4 below shows loss of individuals. The loss of a single colony (by 41 individuals) represents 45.5% of total individuals reporting loss. Four individuals (4.5%) lost seven or more colonies. The highest loss by a single beekeeper was 14 colonies. Loss numbers are reflective of the fact that the median number of bee colonies of backyarders was four colonies. Of 200 colonies lost in Oregon, individuals with 1, 2 or 3 colonies lost 57 colonies, 34%; individuals with 4 to 6 colonies (216 total colonies) lost 22%. Individuals with six or fewer colonies lost 27.5% of their colonies. The 39 individuals with 7 or more colonies lost 36.5% of their colonies while individuals with 10+ colony numbers lost ½ that level – 14.5% of their colonies.
The 20 Individuals who had 12 to 41 colonies lost 57 total colonies. These individuals lost anywhere from 1 to 12 colonies; 8 individuals with 12 or more colonies lost no colonies. This group lost a one-quarter fewer colonies (15%) than the overall statewide group (20%) and slightly less than ½ of individuals with 1-3 colonies (34% loss average).
Survey respondents are primarily small colony number beekeepers – 47% had 1-3 colonies but they vary considerably in their years of beekeeping experience. Looking at losses by colony holding numbers, the 81 individuals who had 1-3 colonies had 34% loss level, the 46 individuals with 4-6 fall colonies (27% of individuals) had a 22% loss level, the 19 individuals with 7-9 fall colonies (20% of individuals) had a 14% loss level and the 20 individuals with 10+ colonies (12% of respondents) lost 21% of their colonies. Numbers are close to those of last year.
By years of experience, the 56 individuals who had 1 to 3 years bee experience (33% of total respondents) had 27% colony loss level and the 49 individuals with 4-6 years experience (29% of
survey takers) had a 19% loss level. Individuals with 6 or fewer years experience, 60% of total respondent number, had 22% loss level. The 27 individuals with 7-9 years experience (16% of respondents) had a 14.5% loss level and those 40 individuals (23% of respondents) with 10+ years experience had a 20.5% loss level. Thus the 40% of survey respondents with 7 or more years experience had an 18.5% loss level. As colony numbers or years experience increase the percent loss level decreases.
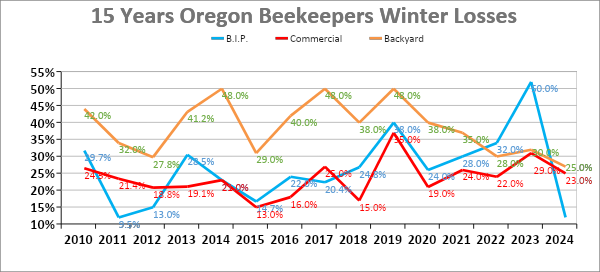
Overwinter Losses the Past 14 Seasons
Comparison of the annual losses of backyarders with commercials is shown in Figure 7. The commercial losses are obtained from a different paper survey distributed by Oregon State University. The numbers for the current year are early returns of 4 commercial and 3 sideliner beekeepers (total colony number fall=13,538 and 3 sideliner beekeepers (449 colonies). Commercial loss rate is 23.5 and sideliner is 16. Fifteen-year average Backyard losses =36.7% loss and 15-year commercial/semi-commercial loss = 21.7%. The Bee Informed average=23.7.
Some Other Numbers
Twenty-five individuals (15%) had more than a single apiary location. The loss level at 2nd apiary was higher in seven instances but also was lower at the original site in the same number of instances. Seventy-seven percent (77%) of respondents (3% above last year) said they had a mentor available as they were learning beekeeping. Fifty-four individuals (31%) had more than one hive type. And, finally, 10 individuals (6%) moved their bees. One move was sale/gifting of hives, one was due to owner move, one was due to conflict with neighbor, two were for better site, one move was due to bear attack and four were for pollination of crops. Distances were within the same property up to miles away (for relocation and pollination).
Perceived Colony Death Reason and Acceptable Level
The survey asked individuals that had colony loss (81 individuals had no loss) to estimate what the reason might have been for their loss (multiple responses were permitted). There were 167 total listings, 1.85/individual. Queen issues (38), weak in the fall (31) and varroa (30 individuals) were most common. Starvation, 16 selections and yellow jackets, 11 respondent choices, along with don’t know (12 selections) were 3 additional double-digit choices. Among others one indicated extreme cold and rain, another cited lack of attention, one said pigs knocked hives over and another that wind blew cover off exposing the bees. See Figure 6 graph below.
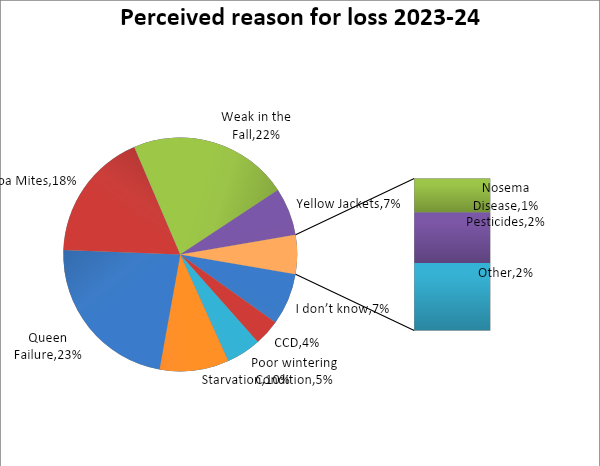
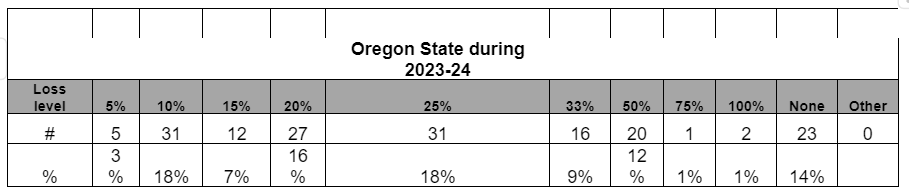
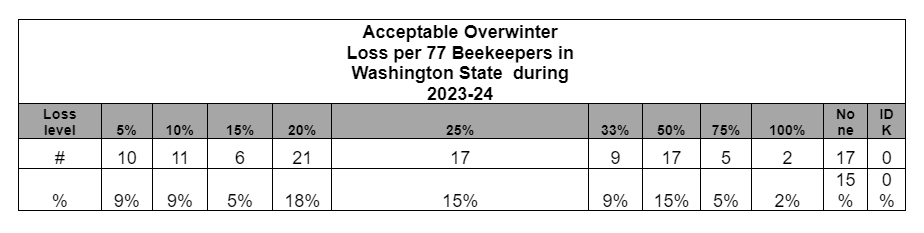
Acceptable loss: Survey respondents were asked the reason for loss. Twenty-three (14%) indicated zero (no loss). Thirty-eight percent of individuals indicated 15% or less; 20% was medium choice, as has been the case for several years. The most common response was 25%. Thirteen percent said 50% or greater was an acceptable loss level; one said 75 and 2 said 100% loss levels acceptable. See table below.
Why do colonies die?
There is no easy way to verify reason(s) for colony loss. Colonies in the same apiary may die for several reasons. Examination of dead colonies is at best confusing and, although some options may be ruled out, we are often left with two or more possible reasons for losses. A dead colony necropsy can be of use. Opinions vary as to what might be an acceptable loss level. We are dealing with living animals which are constantly exposed to many different challenges, both in the natural environment and the beekeeper’s apiary. Individual choices varied from zero to 100%, with a medium of 20%.
The major factor in colony loss is thought to be mites and their enhancement of viruses especially DWV (deformed wing virus), VDV (Varroa destructor Virus (also termed DWV B) and Israeli and chronic paralysis virus. But we do not have a test for these viruses. It was interesting in that queen problems were the most frequently indicated as were weak in the fall as leading reasons for loss.
Declining nutritional adequacy/forage and diseases, especially at certain apiary sites, are additional factors resulting in poor bee health. Yellow jacket predation is a constant danger to weaker fall colonies. Management, especially learning proper bee care in the first years of beekeeping, remains a factor in losses. What affects our changing environment such as global warming, contrails, electromagnetic forces, including human disruption of them, human alteration to the bee’s natural environment and other factors that play in colony losses are not at all clear.
There is no simple answer to explain the levels of current losses nor is it possible to demonstrate that they are necessarily excessive for all the issues our honey bees face in the environment. It was encouraging to see from survey responses that losses this past year 30% were still at a low level. More attention to colony strength and possibility of mitigating winter starvation will help reduce some of the losses. Effectively controlling varroa mites will help reduce losses.
Colony Managements
We asked in the survey for information about some management practiced by respondents. The survey inquired about feeding practices, wintering preparations, sanitation measures utilized, screen bottom board usage, mite monitoring, both non-chemical and chemical mite control techniques and queens. Respondents could select multiple options and there was always a none and other selection possible. This analysis seeks to compare responses of this past season to previous survey years.
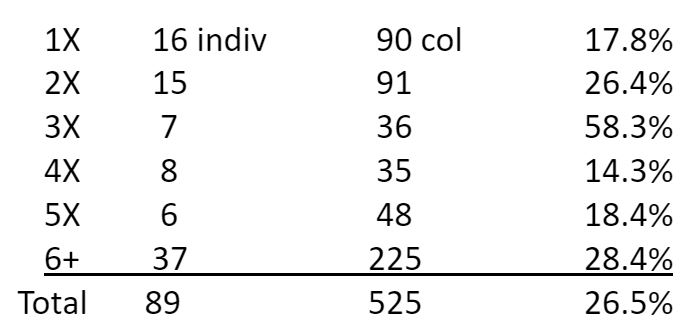
FEEDING: Oregon survey respondents checked 531 feeding options = 3.1/individual (same as last year). Eighteen individuals (9%), other than those who indicated no feeding, selected a single choice and had 18% loss, 37 (22% of respondents) indicated 2 choices (13%, loss), 48 (30%- the greatest number and medium) indicted 3 choices (they had 24% loss), 36 individuals (22%) had 4 choices with 20% loss, 24 (14%) had 5 choices (26 ½ % loss), 3 individuals (2%) had 6 choices with 27% loss. And 1 had 7 selections (there were 10 total listed selections + “other”) with 22% loss.
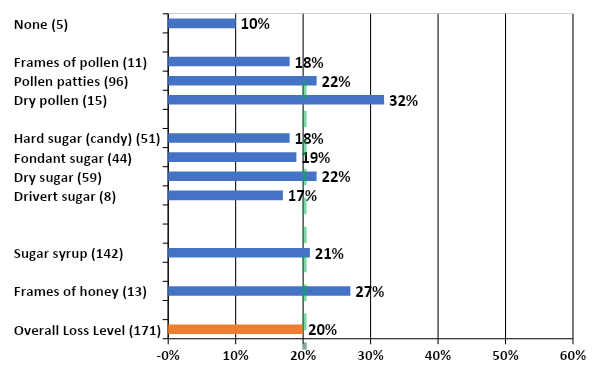
The managements with the number of individuals making that selection are in ( ) in Figure 10; bar length indicates loss level of individuals doing this management. Those bar lengths to the left of the 20% green dashed marker had better survival while those to the right had greater loss level. Five individuals (6 fewer than the previous year) said they did NO FEEDING. They had 29 fall colonies, lost only three for a 10% loss, the best survival 90% of any group or management. For individuals indicating one or more feeding managements, feeding sugar syrup was the most common feeding option of respondents (142 individuals, 86% of respondents who indicated feeding management, same as previous year). Their loss rate was 20.5%, essentially the same as the overall average.
Individuals feeding protein 103 individuals (62% of respondents) had an overall survival rate of 21.5%. Pollen patty feeders (96 individuals, 58% of total respondents, 6 % fewer than last year) had a 22% loss rate, 11 individuals feeding frames of pollen had 17.5% loss (the best survival of the three pollen feeding methods) and 15 feeding dry pollen reported a 32% loss. The 101 (62% of respondents) non-liquid sugar feeders had an overall 21% survival rate. Best survival rates were the 47 drivert/fondant feeders (these two sugars are the same thing but are sold under the two names) with 18%, same as candy feeders. Dry sugar feeders had 22% loss. Differences were marginal.
Summary: Statewide for the last 8 years individuals doing no feeding had only a 4.5 percentage point higher loss (average 40.5%) i.e. poorer survival, compared to an average loss rate of 35%. The average percent doing no feeding = 6.5% of individuals – this year it was 3%). This year the five individuals who did no feeding had ½ the loss rate. Individuals statewide that fed sugar syrup had a 3.8 4.3 percentage point lower loss level average for the 8 years; this year it was one-half percentage point lower survival (on figure 7 it is one percentage point =21% due to rounding). Those feeding honey (as frames or liquid) had lower loss only during three of the past 8 years, this year it was a seven-point greater loss (no respondents indicated feeding liquid honey this year).
Individuals feeding non–liquid sugar (in any form) had lower losses six of past eight past winter seasons; this year it was a single percentage point greater. Dry sugar feeders had slightly better or equal survival 7 of 8 past winters (this winter was the exception); hard candy feeders had improved survival 7 of 8 past winters, including this past winter though it was only a 2-point difference. Fondant feeders had better survival four of the eight past winters; it was a single point improvement this year.
For individuals feeding protein, the protein patty users showed better survival 6 of 8 years (this year losses were two percentage points greater); dry pollen feeders had better survival in three of the past eight years. The 11 individuals indicating they fed frames of pollen had the best survival this year.
It is clear that feeding, while a beneficial management, does not, by itself, significantly improve overwintering success. Those doing no management, average of 6.5 percent of respondents have generally had a higher loss with 8-year average of 4.5 percentage points but some years there are exceptions, such as this past winter. Colony numbers (29 this past winter) are usually not large.
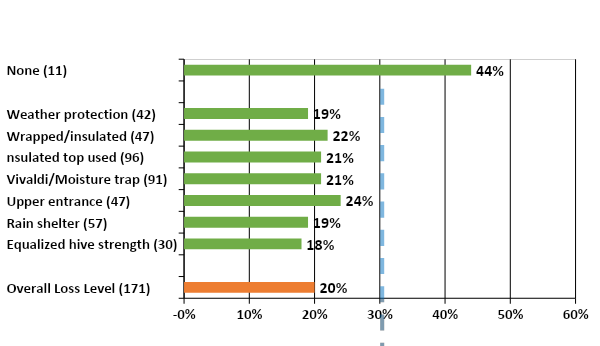
WINTERING PRACTICES: We received 427 responses (2.5/individual – same as last year) about OR beekeeper wintering management practices (more than one option could be chosen). Eleven individuals (6 ½%) of the respondents indicated doing none of the several listed wintering practices; these individuals had an elevated 44% winter loss, more than double overall loss. For those indicating some managements, 29 individuals (18%) did one single thing, (14.5% loss), 50 respondents (32%) did 2 (32% loss), 47 individuals (median number) did three (23% loss), 21 did 4 (17% loss), 7 did 5 (11% loss) and 3 did 6 with 14% loss. Doing more did not ensure overwintering success.
The most common wintering management selected was insulated top (196 individuals, 61% of respondents an increase of nine percentage points from the previous year) followed closely by ventilation/use of a quilt box at colony top (91 individuals (58%), one percentage point lower compared to previous year. There was only a ½ percentage point difference in loss between the two. Figure 8 shows percent of individual choices and bar length shows percent winter loss of each selection. Bars to the left of the green dashed line means better survival than overall. Only equalizing (along with insulted top) improved winter survival.
Summary: Over the past seven years individuals that did no winterizing practice (average 10.6% of individuals) averaged 41.7 loss compared to 35.2% overall average loss of last 7 years, a 6.5 percentage point poorer survival rate. Use of an insulated top winterizing management improved survival 6 of 7 years (but not this year) – (7-year average loss of 28,7%, a 6.5-percentage point improvement). Vivaldi/quilt box, plus upper entrance (most Vivaldi boards have an upper entrance built into the equipment), wrapping and wind/weather protection had only slightly improved survival rates and were not noted in all past 7 years. Equalizing hive strength was the best management to improve survival the past three years but only two percentage points difference.
Like feeding, winterizing efforts, while useful for some persons, is not by itself a means to significantly improve wintering success.
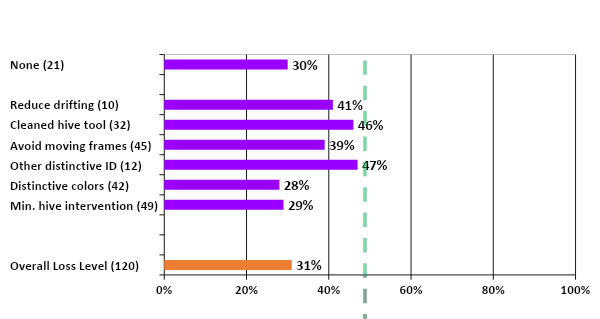
SANITATION PRACTICES: It is critical that we practice some basic bee sanitation (some prefer use of term bee biosecurity) in our bee care to help insure healthy bees. We received 365 responses for this survey question 2.1/individual (0.3 percentage points lower than last year). Twenty-nine individuals (one less than last year) said they did not use any of the six offered alternatives; they had a loss rate of 16.5% compared to the overall rate also 20%. Over the past five-years those indicating doing nothing had a 37.9% percent loss rate, four percentage points higher than the average loss rate of 33.9% over the same time period. This year those doing nothing had better survival (by 3.5 percentage points. Forty-three (30 %) individuals had 1 selection with 27% loss, 44 had 2 choices (the median number) with 17% loss level, 30 selected 3 managements (24% loss level), 18 had 4 (13% loss level), 6 had 5 selections with 25% loss level and one individual with 34 colonies had 6 selections with21% lose and one had 7 selectins and didn’t lose any of 7 colonies.
Minimal hive intervention (81 individuals) was the most common option selected, as it has been for the last 4 years. It could be argued that less intervention might mean reduced opportunity to compromise bee sanitation efforts of the bees themselves and that excessive inspections/ manipulations can potentially interfere with what the bees are doing to stay healthy. This option, however, did not demonstrate improved winter survival; the loss rate for this group the past 7 years was 44%, 10.3 percentage points above the average 7-year loss of 33.7% loss rate compared to those individuals that did nothing.
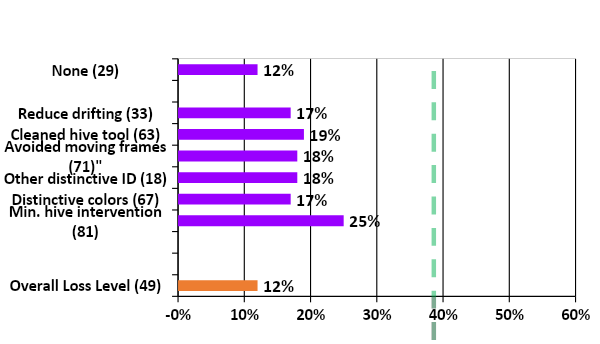
Figure 9
Avoiding moving frames and reducing drifting were the two sanitation choices that demonstrated better average survival the past six years – 7-year loss rate was 32% for not moving frames which is 1.7 percentage points better survival (the past three years it has been 2 percentage points higher than average) and 28.6% for reducing drifting a 5.1 percentage point improvement in survival. Overall sanitation appears to be relatively minor toward improving survival.
SCREEN BOTTOM BOARDS (SBB)
Although many beekeepers use SBB to control varroa, BIP and PNW surveys clearly point out they are not a highly effective varroa mite control tool. In this recent survey, statewide 26 19 individuals (15%) said they did not use screen bottom boards – 26% said they used sometime. Average non-use for the last eight years is 16%, vs 84% use, on some or all colonies. Figure 10
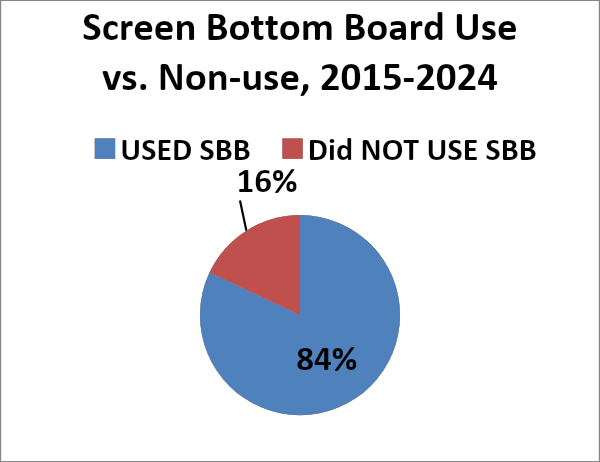
This past overwintering season, the 26 non-SBB users had winter losses of 28 colonies a 22.5% loss. Examining the eight-year average of SBB use, loss level of the 84% using SBB on all or some of their colonies had a 32.2% loss level whereas the 16% not using SBB had loss rate of 35.2%, a 3-percentage point positive survival gain for those using SBB versus those not using them. Screen bottom boards offer a minor improvement for overwinter survival.
We asked if the SBB was left open (always response) or blocked during winter. This past season, 34.5%, 194 individuals, said they always blocked SBB during winter; 26 individuals statewide said they blocked some of the SBBs. Statewide those who blocked always or sometimes had 763 colonies in the fall and lost 150, a 19.7% loss rate. Those 38 who never blocked had a 21% winter loss, a mere 1.3-percentage point difference. As in past years, there was a slight advantage in favor of closing the SBB over the winter period to improve survival.
Summary: Screen bottom board use has a slight survival advantage. For those using SBB, the advantage appears to be to close, partially or completely, the screen over the winter period.
Mite monitoring/Sampling and Control Management
We asked the percentage of Oregon hives monitored for mites during the 2023 year and/or overwinter 2023-24, whether sampling was pre- or post-treatment or both and, of the five possible mite sampling methods, what method was used and when it was employed. 110 individual respondents (64 %), four percentage points below the previous year, said they monitored all their hives. The losses of those individuals monitoring were 21 %. Thirty-two individuals (17%) reported no monitoring; they had a higher loss rate of 28% loss. 30 individuals reported monitoring some of their colonies; they had a 15% loss.
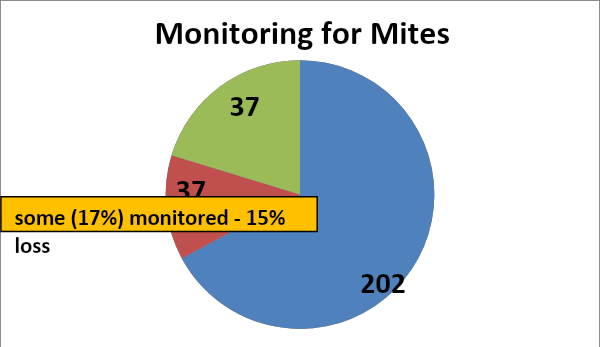
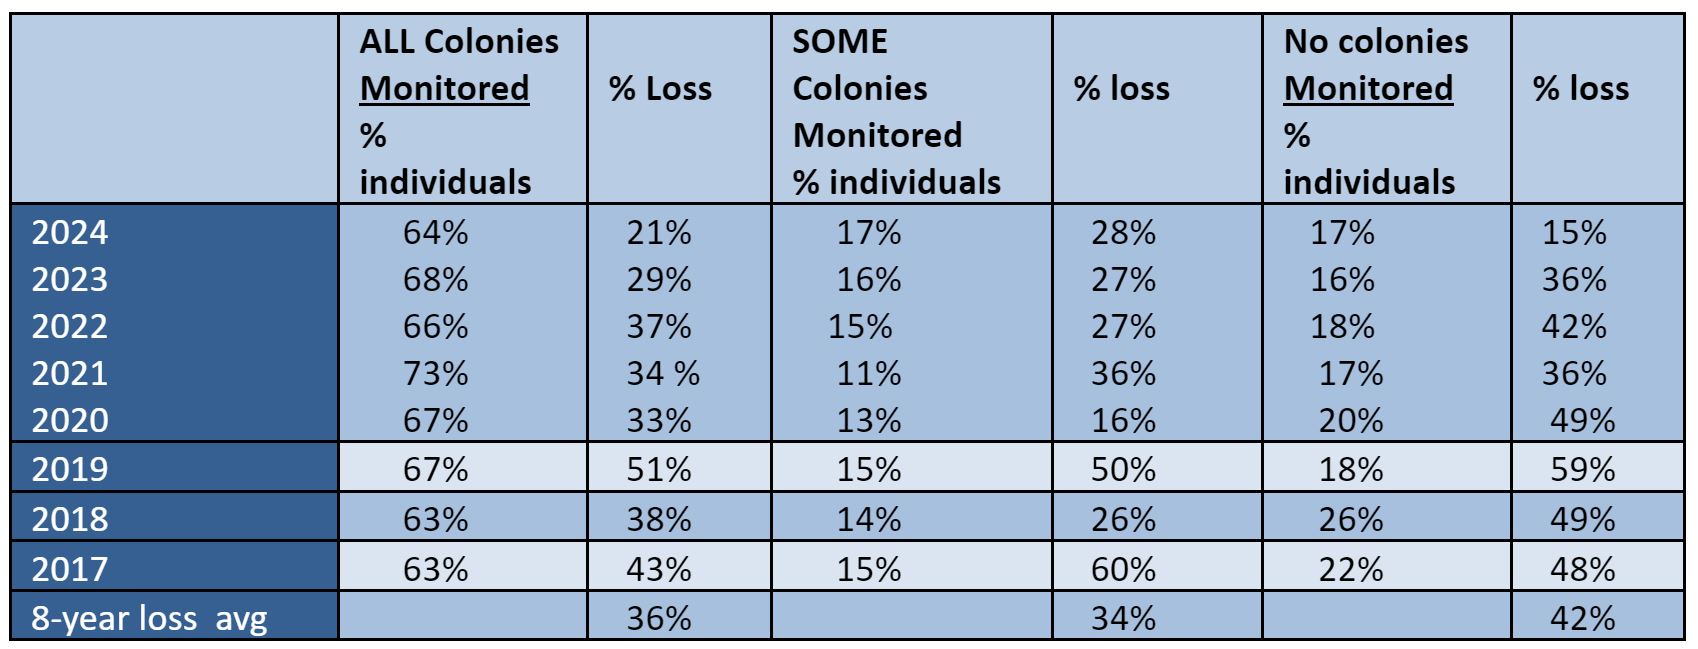
Monitoring alone is a means towards improved winter survival. The table below compares % individuals and % winter loss for individuals who monitored all colonies compared with those who monitored none. The eight-year difference is six percentage point better survival monitoring all colonies. The loss rate of 16-26% who monitored some colonies was variable, averaging two percentage points lower than those monitoring all colonies.
Individuals indicated use of 1.85 monitoring techniques on average. In total choices, in order of popularity of use, 78 individuals used alcohol wash and 70 individuals used Sticky boards (58 and 52% respectively of those responding to using a monitoring technique. The 78 using alcohol wash had18% loss while those using sticky boards had a 19% loss.
Seventeen individuals used powdered sugar monitoring; visual inspection of drones (57 individuals) and visual inspection of adults (56 individuals) were also indicated. In the past 5 years, the use of sticky boards has decreased in use and alcohol wash has increased in use. This was only the second year Alcohol use monitoring was the major monitoring technique. Figure 12 below Illustrates percent using the five monitoring methods.
Whatever technique used, most sampling to monitor mites was done in July – September, as might be expected since mite numbers change most quickly during these months and sampling results can be used to key control decisions. Figure 13 illustrates monthly sampling with five methods.
Figure 13
The most common sampling of respondents is both pre- and post-treatment (42% average). The sampling pre-treatment percentage has been decreasing while post treatment sampling has slowly been increasing. It is important to know if the treatment works so post treatment should not be avoided. Treatment without sampling was 13%, (last year it was 28% an anomaly, double the more typical percentage of this year).
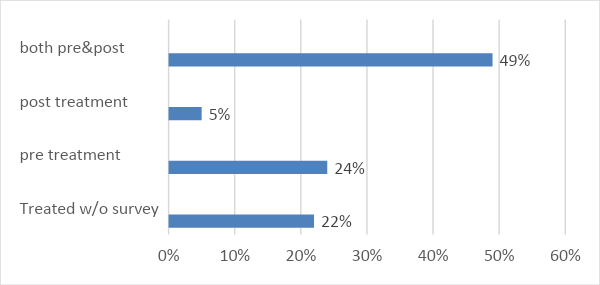
Figure 14
It is important to KNOW mite numbers. Less effective mite monitoring methods include sticky (detritus) boards below the colony. Often so much detritus drops onto a sticky board that counting the mites can be hard, especially for new beekeepers. Sticky boards used for a single day pre- and post-treatment can help confirm the effectiveness of a treatment, if numbers drop post treatment. Visual sampling is not accurate: most mites are not on the adult bees, but in the brood, especially when there is a lot of brood. Adult mites are NOT on the adult body where they can be observed (over 90% are on the lower abdomen, tucked within the overlapping bee sternites). Sampling for mites in drone brood needs to be refined as a predictive number; they can be used as an early warning ls cells had mites.
See Tools for Varroa Monitoring Guide www.honeybeehealthcoalition.org/varroa on the Honey Bee Health Coalition website. The Tools guide suggested mite level to use to base control decisions based on the adult bee sampling. A colony is holding its own against mites if the mite sample is below 2%. It is critical to not allow mite levels to exceed 2-3% during the fall months when bees are rearing the fat fall bees that will overwinter. It is also the most challenging time to select a control method (if one is deemed needed) as potential treatment harm may negatively impact the colony. We are seeing more colonies suddenly disappear (abscond?) during the fall, which may be related to the treatment itself.
Mite Control Treatments
The survey asked about non-chemical mite treatments and also about use of chemicals for mite control. Twenty-eight individuals (16%), two percentage lower than last year, said they did not employ a non-chemical mite control and 10 individuals (6%), one-half the percentage as last year, did not use a chemical control. Those 28 individuals who did not use a non-chemical treatment reported a 17% winter loss, three percentage points lower than overall, while those 10 who did not use a chemical control lost 23% of their colonies, three percentage points higher than overall. The individual options chosen for non-chemical control and chemical are discussed below.
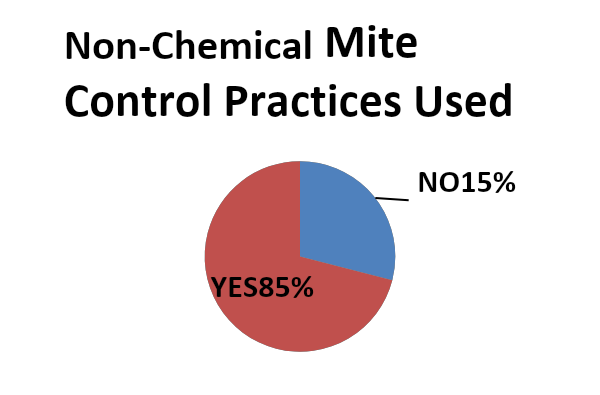
Non-Chemical Mite Control: Of nine non-chemical alternatives offered on the survey (+ other category) 35 individuals (28%) used one method, 45 used two, 31 used three, 19 used 4, 9 used 5 and 4 individuals used 6. Individuals using a single method had 27% loss rate, those using two had a 18% loss rate, those with three had a 19% loss, the 19 using 4 had lowest loss level of 11% and the smaller number using 5 and 6 both 19%. Clearly using more than one method/tool improves success.
114 individuals (67% of total respondents – 9 percentage points lower than last year) listed use of screened bottom board. The next most common selection was distinctive colors (62 individuals= 36% of respondents). The use of the remaining selections is shown in Figure 19; number of individuals in ( ), bar length represents average loss level of those individuals using each method. Those left of green dashed line had improved survival.
Figure 16
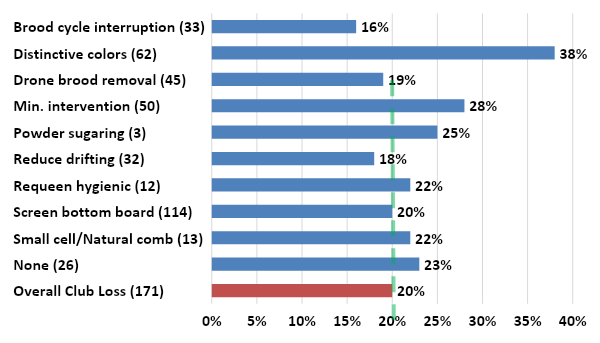
Two of the non-chemical alternatives have demonstrated reduced losses over past 7 years. Reducing drifting such as spreading colonies (28 % loss average for 6 years – question not asked in 2016-17 survey) and brood cycle break (31.3.% average) have consistently year after year demonstrated somewhat better survival than average loss (33 % average loss last 6 years and 35.4 % loss last 7 years respectively). Different colony colors in apiary 36% did not improve survival in fact loses were nearly double the loss average loss and drone brood removal (34.4% average loss) were only one percentage point better than average 6-year loss (35.4%).
Chemical Control: For mite chemical control, 10 individuals (6% of total respondents) used NO chemical treatment. They had a loss level of 23%. Those using chemicals used at rate of 2.3/individual which is considerably less usage than the previous year when it was 3.3/individual. Forty individuals (26%) used one chemical. Overall, these individuals had a 31% loss level. The 15 single chemical oxalic acid vaporization users had 22.6% loss (used median of 4 times); the 8 formic acid single chemical users (evenly split in use one or two times) did slightly better at 20% loss level while the 8 Apivar single chemical users (also evenly split with use one and two times) had a 61% loss level.
Fifty-three individuals (median number) used two chemical selections (loss level 21%); greatest number combined formic acid with another chemical and had 17% loss; 9 individuals combined Apivar with formic fumigation and had 44% loss. Forty-two individuals indicated they used three chemicals and had 13.7% loss, 16 indicated four selections and had 15.7 loss level, 3 used 5 with 19% loss and finally 2 used 6 (lost 3 of 16 colonies and one eight different chemicals with 9 of 40 colonies lost
There are two essential oil products on the market. Apiguard, the thymol gel, was used by forty-six individuals. They had loss level was 17% overall. The thirty-four individuals that used it once had a 16.5% loss, the nine using it twice had loss of 12.5%, the 2 using it 3 times lost 2 of 4 colonies. ApiLifeVar, the wafer thymol product was used by eighteen individuals – their overall loss was only 9%. Those fifteen who used it once lost 10%, the two individuals using it twice loss no colonies. The one individual that used eight different chemicals indicated using it over six times and lost 9 of 40 colonies (23% loss level).
One hundred-three respondents (66%) indicated they used oxalic acid vapor (OAV), sixteen used oxalic acid dribble (OAD) and thirty-seven used oxalic acid extended (OAE). Loss rates were 18% for OAV (706 fall colonies), 16% for OAD (138 fall colonies) and 12% for OAE (364 fall colonies). For OAD, thirteen used it once with 10% loss and 3 used it twice (46 fall colonies) but had 28% loss.
For Oxalic acid fumigation (OAF) thirty-two individuals used it once (198 fall colonies) with 18.7% loss, 21 individuals used it twice and another 21 used it three times (losses 22.4% and 15.2% respectively), 11 used it 4 times (20.3% loss), 6 used five times (15.6% loss) and 11 used it 6+ times (8.3% loss). For oxalic acid extended (OAE) the actual method used might have varied a great deal as everyone was “experimenting” on their bees as there is no approved product, or even application method. Twenty-two individuals used it once and had 10% loss, 8 used it twice with 16% loss and 3 said they used it 3 times with 19% loss.
Not shown in Figure were five individuals who indicated “other.” One, with six colonies, lost 1/3rd, said they used thyme with mineral oil; one other mineral oil user with a single colony lost that colony. The three individuals using powdered sugar for mite control were included in the non-chemical data above. They lost 1 of 4 colonies for 25% loss level.
Consistently over the last 8 years, four different chemicals have helped beekeepers improve survival. These were essential oils Apiguard (average 8-year loss level 27.6%), Apivar (29.9% average 8-year loss level), ApiLifeVar (29% average loss level over last eight years) and Oxalic acid vaporization (also 29% average loss level over last 8 years.
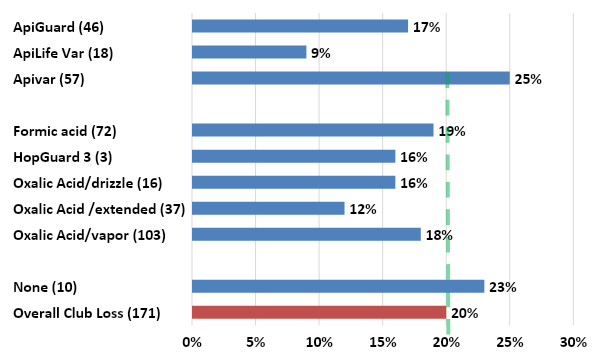
The average loss level has been 35.7% the last 8 years. Formic acid too has done better than average the last 7 years but the product has changed from MAGS to Formic Pro so I cannot be sure what Formic acid product was used by the 107 respondents who reported using it. Oxalic acid drizzle did well this year (16% loss level) – average of last 8 years is 33.7%. The extended OAE (absorbing oxalic acid and glycerin into sponges) did very well in promoting better than average survival the past two years and its use has increased dramatically.
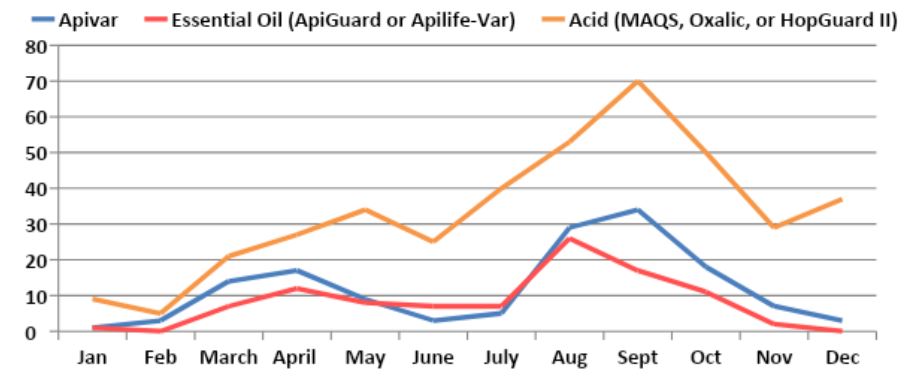
The monthly use of Apivar (blue line), essential oil (red line) or an acid (green line) is shown in Figure 21 for 2021-22 season. Further review is needed to determine if the timing of treatments was more effective than at other times for the various chemicals.
Antibiotic use
Three individuals (<1%) used Fumagillin (for Nosema control) and had a 17% loss rate, slightly better than the total loss and an improvement from the 28.5% loss last year of the fumagillin users. No individuals indicated use of Terramycin, the first year this has occurred.
Queens
We hear lots of issues related to queen “problems”. Queen events can be a significant factor contributing to a colony not performing as expected. We asked if you had marked queens in your hives. Sixty-nine individuals (40%), 3 ½ percentage points greater than last year, said yes. The related question then was ‘were your hives requeened in any form?’ to which 64% (110 individuals) said yes (6 percentage points higher than last year) and essentially equal numbers said no (32) or not that they were aware of (29 individuals).
Closing comments
This survey was originally designed to ‘ground truth’ the larger, national Bee Informed loss survey. See statewide PNW reports for OR and WA for this comparison (graph 5 in this report). The numbers while slightly different do in fact track well. Unfortunately, the national BIP survey was discontinued after 2023. See the BeeInformed website www.beeinformed.org for additional information and to examine that data base as well. The BeeInformed survey is measuring the larger scale OR beekeepers not the backyarders as loss rates are of total colony number. Reports for individual bee groups are customized and only available from the PNW website; they are posted for previous years.
I intend to continue to refine this instrument each season and hope you will join in response next April. I have a blog on the pnwhoneybeesurvey.com and will respond to any questions or concerns you might have. Email me directly for a quicker response. dmcaron@udel.edu
Thank You to all who participated. If you find any of this information of value please consider adding your voice to the survey in a subsequent season. Dewey Caron June 2024
Winter Bee Losses of Washington Backyard Beekeepers for 2023-2024
by Dewey M. Caron
Click here to view a PDF of Washington report.
Overwintering losses of small-scale Washington backyard beekeepers=31%, a decrease of five percentage points from last year, 14 percentage points below the 9-year loss average. One hundred twenty-one Washington respondents completed a survey, one more than last year and two above the 119 average respondent rate of the last five years. Information on winter losses and several managements related to bee health was included on the electronic honey bee survey instrument www.pnwhoneybeesurvey.com.
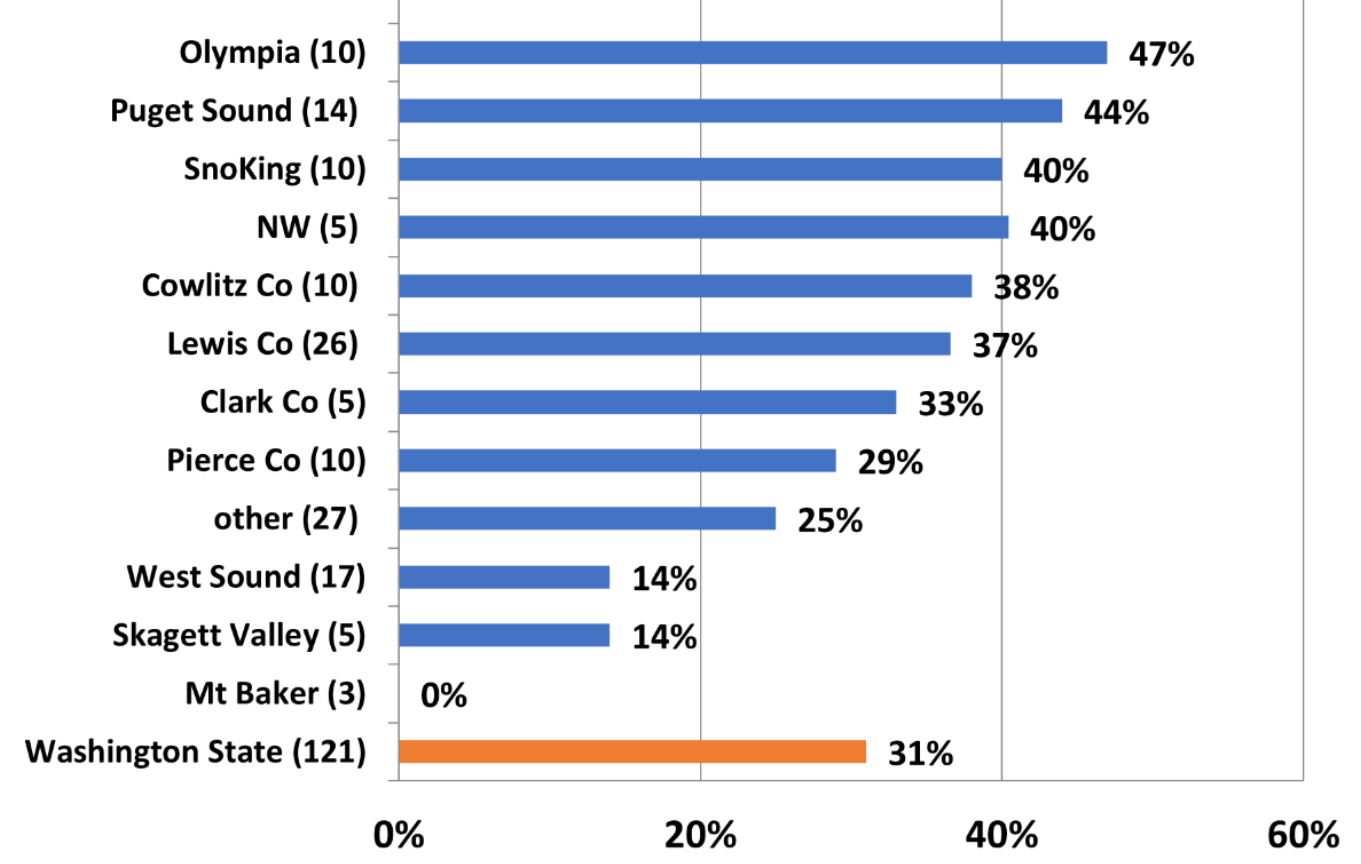
Response by local Washington (WA) association members varied as indicated by numbers adjacent to club name. Losses of those club individuals are shown in blue bars in Figure 1. Statewide loss level was 31%. Survey included 693 fall Washington beekeeper colonies (4 more than last year)
2023-2024 Overwinter Losses by Hive Type
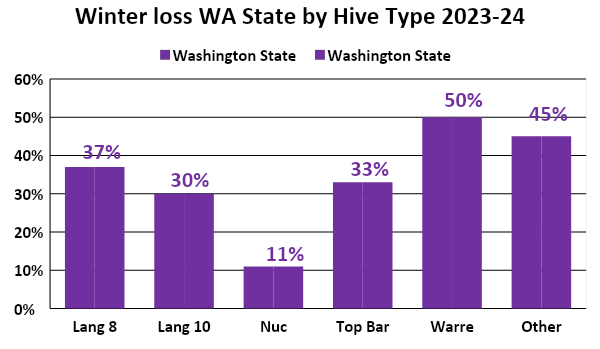
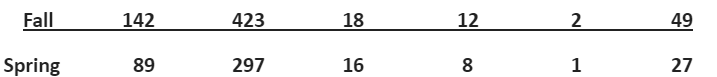
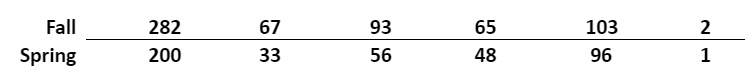
The Washington survey overwintering loss statistic was developed by subtracting the number of spring surviving colonies from fall colony number supplied by respondents by hive type. Results, shown in Figure 2 bar graph, illustrate overwintering losses of 121 total WA beekeeper respondents =31%. Langstroth 8 frame beehives had higher average losses (37%) than Langstroth 10 frames hives. Only two nucs of 18 in the fall failed to survive. Top Bar hive survival rate was similar to the Langstroth hives. One of two Warré hives survived. Of the 18 individuals listing another hive type, 9 were IDed as AZ (only 1/3rd survived), 4 as Layens (all survived) and 13 as long hives (9 survived =31% Loss). The remaining 21 were not identified. (NOTE: Hive type of 47 Fall colonies not captured).
Forty-six individuals had no loss (38%) = 217 colonies while ½ that number (22) 18% had total loss = 68 colonies. Greatest loss was one colony. Heaviest loss was 14 colonies. See Figure 3 graph.
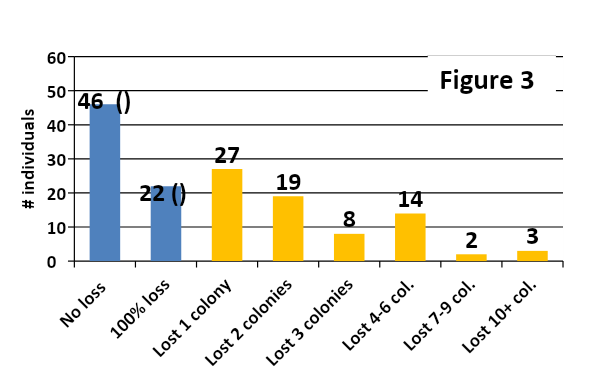
The WA respondents to the electronic survey managed up to 26 fall colonies. Fourteen individuals had a single colony (and had colony loss of 43%), 30 respondents had two colonies (the greatest number) with 33% loss and seven individuals had three colonies (48% loss). Typical of previous surveys, fifty-one individuals (42% of respondents) had 1, 2 or 3 fall colonies (loss level of 41%). Thirty-five individuals had 4 to 6 fall colonies and had a loss level of 43%. Five was the median number. Eighteen individuals had 7 to 9 colonies, they had a loss level of 19%. Ten individuals had 10-19 colonies with a loss level of 30%, 6 individuals with 20-26 colonies had a loss level of 23% The 16 individuals with 10+ colonies lost 27%.
Thirty-six respondents (31% of total) had 1, 2 or 3 years of experience; they had a 30% loss level; the 12 individuals with one year experience had the heaviest loss of 38%. Forty-two individuals (36% of total respondents) had 4 – 6 years’ experience (medium number = 5 years experience) with a 42% loss, 14 individuals had 7-9 years experience (loss level 41%), 17 had 10-19 years keeping bees and 18% loss level and nine had 20+ years experience (64 was maximum) and they had a 26% loss level. Examining the relationship of colony numbers and years experience related to loss shows that loss of colonies decreases by about 1/3rd with the greater number of colonies and/or years of experience.
Summary
1-3 colonies 41% loss 10+ colonies 27% loss
1-3 years experience 30% loss 10+ years experience 20% loss
Eighty-eight (75%) WA beekeepers had an experienced beekeeping mentor available as they were learning beekeeping. This percentage was three percentage points higher than last year, the same as the 5-year average.
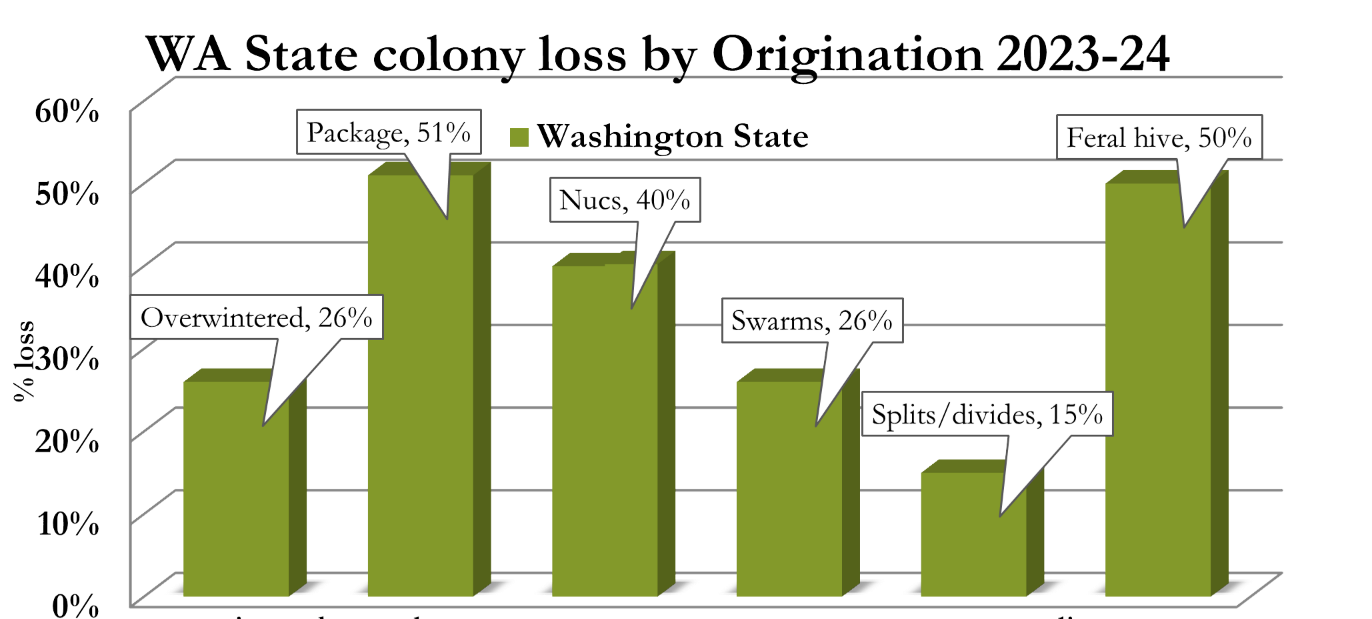
Survival Based on Hive Origination
We also asked about hive loss by origination. Data shown in Figure 4 below. Best survival was Splits/divides (15%) with swarms and previously overwintered both at 16% loss rate. previously overwintered colonies and splits/divides. Package bee losses were over 50%. Both nucs 40% and packages had heaviest losses.
Comparison to Larger-Scale Beekeeper Losses
A different (paper) survey instrument was mailed to Pacific Northwest (PNW) semi-commercial (50-500 colonies) and commercial beekeepers (500+) from OSU asking about their overwintering losses. Response rate was reasonable until 2018 then the response became limited to only three individuals and this was not considered representative of the larger scale beekeepers of Washington. Numbers are shown in red only for the 4 years 2015-2018 in Figure 5 below. The BeeInformed.org (BIP) losses for Washington beekeepers for 2015 to 2023, the last year of the BIP survey, are representative of the larger scale beekeepers and are shown in blue in Figure 7. Losses of backyard beekeepers from this survey are shown in orange line with black loss numbers. Average BIP loss (9 years) =27.9% and average WA backyarder loss (10 years) =44.7%. In 2023 the larger-scale beekeeper loss exceeded losses of backyarders. The numbers included in the survey are shown below the figure.
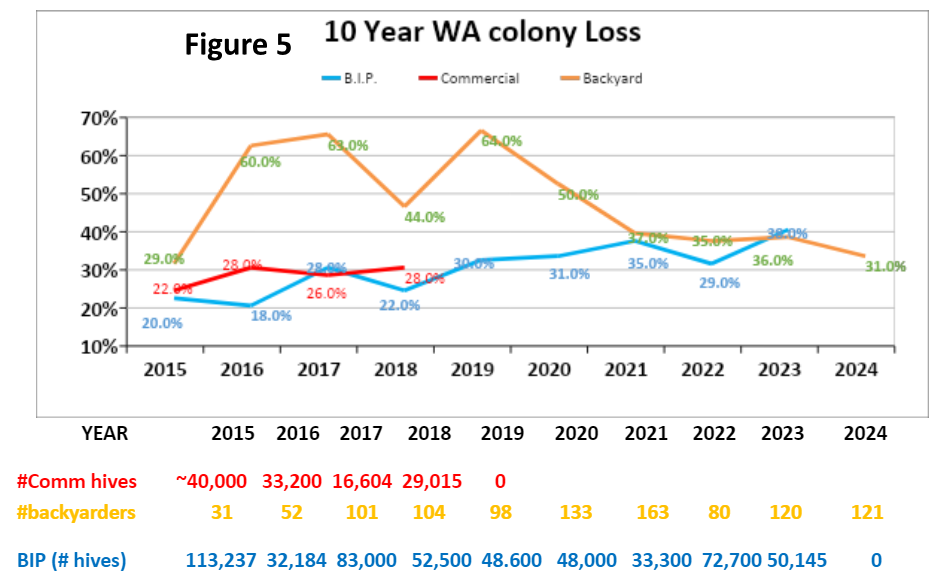
The reasons backyarders have had higher losses are several. Commercial and semi-commercial beekeepers examine colonies more frequently and they examine them first thing in the spring as they move virtually all their colonies to pollinate almonds in February. They also are more likely to take losses in the fall and are more proactive in varroa mite control management.
The PNW survey was conducted in part to “ground truth” the annual BeeInformed Survey (BIP) also conducted during April. The BIP survey includes a mailed survey to larger-scale beekeepers and an electronic survey to which any Washington beekeeper can submit their data. Losses reported include colonies of migratory beekeepers who reported WA as one of their yearly locations. The BIP survey for the 2015-23 annual surveys reports receiving responses from 90 to 95% of respondents exclusive to Washington but they managed less than 5% of total colony count – the BIP tally is primarily of commercial beekeepers. They have large numbers of colonies in survey data, so the BIP losses reflect commercial losses not losses of backyarders. See https://research.beeinformed.org/loss-map/
Apiary sites and moves
Nine survey respondents had bees at more than a single apiary. Loss levels were similar or better at four of the original sites and better at five of the 2nd sites. Three had bees at a third site and losses were higher at two of the 3rd sites. Six individuals moved bees. One moved for pollination, one moved for construction, two moved due to bear attack and two moved for better site (more sun, lower elevation for wintering).
Colony death perceived reason and acceptable loss level
We asked survey takers who had winter losses for the “reason” for their losses. More than one selection could be chosen. In all there were 115 WA selections (1.85/individual) provided. Varroa mites (32 individuals, 25% of total selections) were the most common choices. Weak in the fall, starvation and poor wintering were next most common followed by yellow jackets and don’t know. Ten individuals only listed queen issues. The two “other” listings were absconding and too small a winter cluster. Figure below shows the number and percent of factor selections.
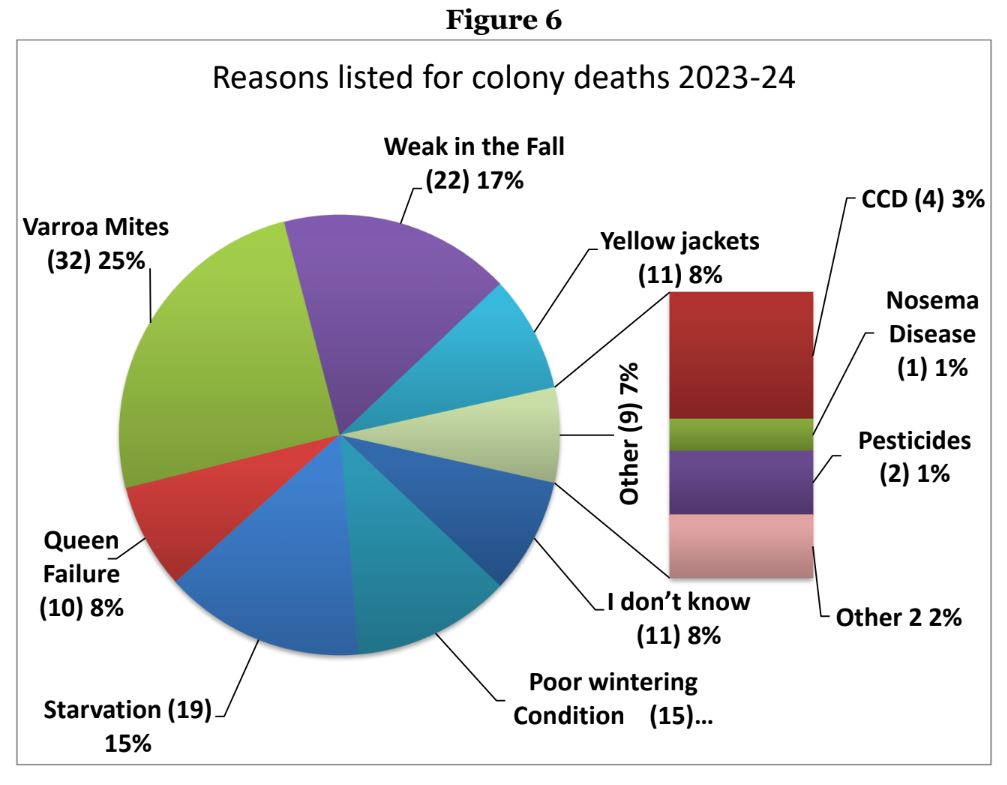
Acceptable loss: Survey respondents were asked the reason for loss. Seventeen (15%) indicated zero (no loss). Thirty-three percent of individuals indicated 10% or less. Twenty percent was a medium choice. Nineteen percent said 50% was an acceptable loss level. See table below.
Why do colonies die?
There is no easy way to verify reason(s) for colony loss. Colonies in the same apiary may die for several reasons. Examination of dead colonies is at best confusing and, although some options may be ruled out, we are often left with two or more possible reasons for losses. A dead colony necropsy can be of use. Opinions vary as to what might be an acceptable loss level. We are dealing with living animals which are constantly exposed to many different challenges, both in the natural environment and the beekeeper’s apiary. Individual choices varied from zero to 100%, with a medium of 20%.
Major factors in colony loss are thought to be mites and their enhancement of viruses especially DWV (deformed wing virus), VDV (Varroa destructor Virus (also termed DWV B) and Israeli and chronic paralysis virus. But we do not have a test for these viruses. It was interesting in that queen problems were the most frequently indicated as were weak in the fall as leading reasons for loss.
Declining nutritional adequacy/forage and diseases, especially at certain apiary sites, are additional factors resulting in poor bee health. Yellow jacket predation is a constant danger to weaker fall colonies. Management, especially learning proper bee care in the first years of beekeeping, remains a factor in losses. What affects our changing environment such as global warming, contrails, electromagnetic forces, including human disruption of them, human alteration to the bee’s natural environment and other factors that play in colony losses are not at all clear.
There is no simple answer to explain the levels of current losses nor is it possible to demonstrate that they are necessarily excessive for all the issues our honey bees face in the environment. It was encouraging to see from survey responses that losses this past year 30% were still at a low level. More attention to colony strength and possibility of mitigating winter starvation will help reduce some of the losses. Effectively controlling varroa mites will help reduce losses.
Colony Managements
We asked in the survey for information about some management practiced by respondents. The survey inquired about feeding practices, wintering preparations, sanitation measures utilized, screen bottom board usage, mite monitoring, both non-chemical and chemical mite control techniques and queens. Respondents could select multiple options and there was always a none and other selection possible. This analysis seeks to compare responses of this past season to previous survey years.
Most Washington beekeepers do not perform just one management to their colony (ies) toward improving colony health and overwintering success. This analysis compares a single factor equated with loss level. Such analysis is correlative and doing a similar management as fellow beekeepers does not necessarily mean you too will improve success.
FEEDING: Washington survey respondents checked 396 feeding options = 3.1/individual. One individual made no selections – they had two colonies and lost both (100% loss). One respondent indicated a single choice (feed frame of honey) and lost one of their two colonies 50% loss level. One individual with eight colonies made eight selections and all 8 survived. The best survival results were 2 or 6+ selections. Table illustrates the relationship of number of selections to percent making selection (median was 3) and percent loss of those individuals.
| # selections | # indiv (%) | % loss |
| 1 | 1 (<1%) | 50% |
| 2 | 22 (18%) | 25% |
| 3 | 46 (38%) | 38% |
| 4 | 35 (29%) | 39% |
| 5 | 5 (4%) | 53% |
| 6 | 6 (5%) | 23% |
The choices, with number of individuals making that selection, is in ( ), bar length indicates loss level of individuals doing this management (Figure 7). Those bar lengths to left of 31% (green dashed line) had better survival while those to right had greater loss level.
Figure 7
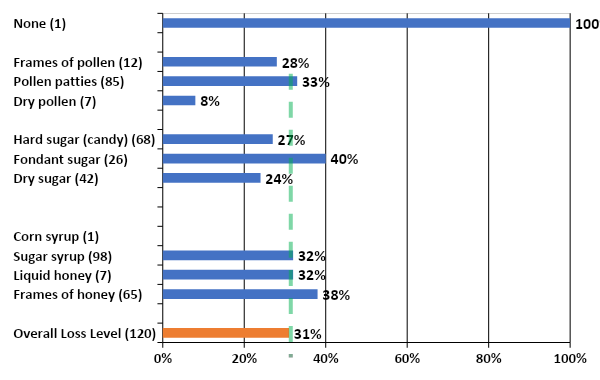
Feeding sugar syrup (98 individuals) and pollen patties (85 individuals) were the most common feeding option of respondents. Both had loss rates similar to overall loss rate (32 and 33% respectively). The loss rate of the seven dry pollen feeders was only 8 percent while 42 dry sugar feeders had a 24% loss level.
For the last 6 years of survey losses statewide, individuals doing no feeding had poorer survival in 6 of the 7 years, but numbers of individuals/colonies involved were generally low – this year one individual lost their two colonies. Individuals that fed sugar syrup had marginal lower loss level in four of seven years (but not this year) as did those using frames of honey to feed bees (this year 7 percentage point greater loss). Individuals feeding non–liquid sugar in the form of hard candy likewise had lower losses in 5 of 7 years; this year 4 percentage points better survival. Dry sugar feeders had bet survival of those feeding carbohydrate (except one individual fed corn syrup and both of their colonies survived).For individuals feeding protein, protein patty users showed slightly better survival in 4 of 7 years (this year 2 percentage points poorer survival); dry pollen feeders had significantly better survival in five of the past six years but number of individual respondents doing this management is not very large.
WINTERING PRACTICES: We received 330 responses (2.7/individual compared with 2.9/individual last year) reporting WA beekeeper wintering management practices (more than one option could be chosen). One individual indicated doing none of the several listed wintering practices (same individual that did no feeding – the two colonies reported lost were one 10-frame and one 8-frame colony. One individual doing seven selections lost 2 of 3 colonies.
| # selections | # indiv (%) | % loss |
| 1 | 24 (19%) | 53% |
| 2 | 32 (26%) | 27% |
| 3 | 29 (23%) | 23% |
| 4 | 24 (19%) | 26% |
| 5 | 10 (8%) | 29% |
| 6 | 4 (3%) | 60% |
For those indicating some management, 24 did one single thing and had 53% loss level. The best survival was those with three selections. Information presented in table above.
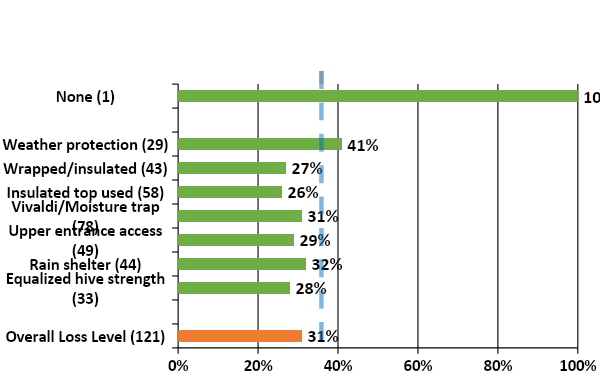
The managements selected that improved survival were wrapping/using colony insulation (30 individuals – 30% loss level), use of Vivaldi/moisture trap (87 individuals, 32% loss) and equalizing hive strength (25 individuals, also 32% loss level). Figure 10 shows the number of individual choices and percent of each selection. Bar length below 36% (blue dashed line) had better than average winter survival.
Over the past 6 years a couple of winterizing managements have shown improved survival. Those doing no winterizing had higher losses all 6 of 7 years. Equalizing hive strength in the fall demonstrated lower loss levels in all seven recent winter periods and top insulation has demonstrated lower loss in five of seven winters. In the most recent winter 58 individuals had a five-percentage point lower survival. Ventilation above the colony (Vivaldi Board/quilt box) demonstrated improved survival four of the seen winters, this year loss level was same as overall loss.
Figure 8
| # selections | # indiv (%) | % loss |
| 1 | 22 (24%) | 26% |
| 2 | 34 (3%7) | 35% |
| 3 | 14 (15%) | 47% |
| 4 | 18 (20%) | 48% |
| 5 | 2 (2%) | 50% |
SANITATION PRACTICES: It is critical that we practice some basic bee sanitation (some prefer use of term bee biosecurity) in our bee care to help insure healthy bees. We received 214 responses for this survey question 1.8/individual (last year it was 2.7/individual). Twenty-one individuals (18%) said they did not practice any of the six offered alternatives; they had a loss rate of 30%, 1 percentage point lower than the statewide average.
Thirty-seven individuals had one selection and had a 26% loss average. 37 made 2 choices with 38% loss. The 13 individuals with three selections had best wintering survival (20% loss), while those 11 with four had 36% loss. It is clear that none of the measures is robust enough to make a difference by itself in reducing winter loss. Figure 9 shows the number of individual choices and percent of each selection. Bar length below 31% (green dashed line) had better than average winter survival.
In all six years doing none of these managements resulted in anything approaching better than average survival; this was the case this past winter when the 21 individuals doing nothing had average statewide losses. The managements of reducing colony drift, providing hives with distinctive color/distinctive hive ID measures are helpful managements but they do not improve overwintering success.
Figure 9
SCREEN BOTTOM BOARDS (SBB)
Although many beekeepers use SBB to control varroa mites, BIP and PNW surveys clearly point out they are not or at best not a very effective varroa mite control tool. In this recent survey 17 Washington individuals (16%) said they did not use screen bottom boards; they lost 30% of their colonies. Those 18 beekeepers using SBB on some of their colonies lost 39% and the 83 individuals (%) using SBB on all of their colonies had 29% loss.
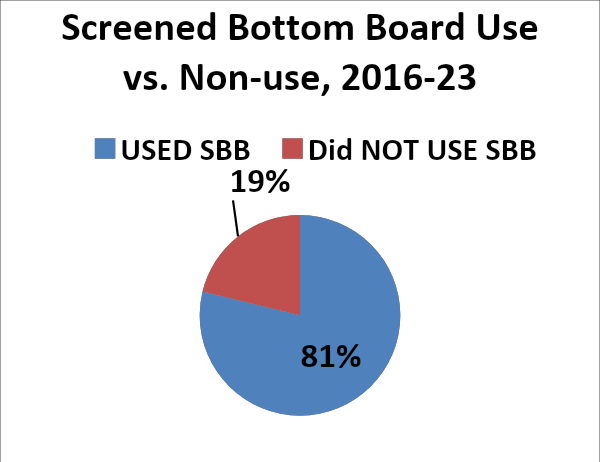
In eight survey years 19% of Washington beekeepers said they did not use SBB and 81% did use SBB on some or all of their colonies, see Figure 10.
Examining the seven-year average of SBB use, those using SBB on all or some of their colonies had a 40% loss level whereas for those not using SBB the loss rate was 40.9% (a 0.1% positive survival gain for those using SBB versus those not using them). SBB are a very minor aid in improving overwinter survival for Washington beekeepers.
We asked if the SBB was left open (always response) or blocked during winter season. Seventy-three individuals (69%) said they always blocked SBB during winter. They had a 32% loss rate. Twenty-five individuals (24%) said they never blocked SBB and had loss rate of 33%. Eight individuals (8%) blocked them on some of their colonies. Their loss rate was 23%. So the 81 individuals that blocked or sometimes blocked screen boards had 32% loss vs those who didn’t block had 33% loss, a 1 percentage point difference in favor of closing the SBB over the winter period. Over the past six years those closing have nearly an 8-percentage point advantage when the SBB is closed during the winter (although it was only a single percentage point difference this season). There is no good science on whether open or closed bottoms make a difference overwinter, but some beekeepers “feel” bees do better with it closed overwinter. An open bottom, at least during the active brood rearing season, can assist the bees in keeping their hive cleaner and promote good hive ventilation.
Things that seem to improve winter success: It should be emphasized that these comparisons are correlations not causation. They are single comparisons of one item with loss numbers. Individual beekeepers do not do only one management option, nor do they necessarily do the same thing to all the colonies in their care. We do know moisture kills bees, so we recommend hives be located in the sun out of the wind. If exposed, providing some extra wind/weather protection might improve survival. Early spring pollen is important so locations where bees have access to anything that may be flowering on sunny winter days is also good management.
Feeding, a common management, appears to be of some help in reducing losses. Feeding dry sugar or fondant during the winter meant lower loss levels. Providing honey or sugar syrup, the most common selection, did not mean lower winter loses but these basic managements are useful in other ways such as for spring development and/or development of new/weaker colonies besides insuring better winter survival.
Feeding protein in any form does seem to slightly improve survival. The supplemental feeding of protein (pollen patties) might be of assistance earlier in the spring season has been demonstrated to help bees build strong colonies, but this may lead to greater swarming.
Winterizing measures that apparently helped lower losses for some beekeepers was equalizing strength, providing a moisture trap (Vivaldi board or quilt box) and some attention to adding protection against the elements. Spreading colonies out in the apiary and painting distinctive colors or doing other measures to reduce drifting also are of some value in reducing winter losses.
It is clear that doing nothing for feeding or winterizing resulted in the heaviest overwinter losses.
Replacing standard bottom boards for screened bottoms only marginally improved winter survival. It is apparently advantageous to close the bottom screens during winter.
Mite monitoring/sampling and control management
We asked percentage of Washington hives monitored for mites during the 2023 year and/or overwinter 2023-24, whether sampling was pre- or post-treatment or both and, of the five possible mite sampling methods, what method was used and when it was employed. Eighty-one individual respondents (68% – an increase of 0.9 percentage points from last year) said they monitored all their hives. Losses of those individuals monitoring was 31%. Twenty-two (18.6%), reported no monitoring; they had a higher loss rate of 35%. Fifteen individuals monitored some with loss rate of 29%.
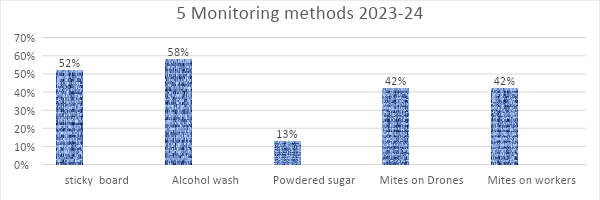
In order of popularity of use, 67 individuals used sticky boards, 65% total of 103 individuals who did some or all monitoring of colonies, same percentage as last year. Looking on adults was indicated by 50 individuals (49%) who did some or all colony monitoring followed by 47 individuals (41% of individuals doing monitoring, an increase of four percentage points from last year) that used alcohol wash. Thirty-one individuals used drone brood monitoring and 12 used powder sugar to monitor. The sticky board users had 30% loss, alcohol washers had 29%, as did those looking a drone brood, worker inspection had 41% and powdered sugar users had the highest loss level at 57%.
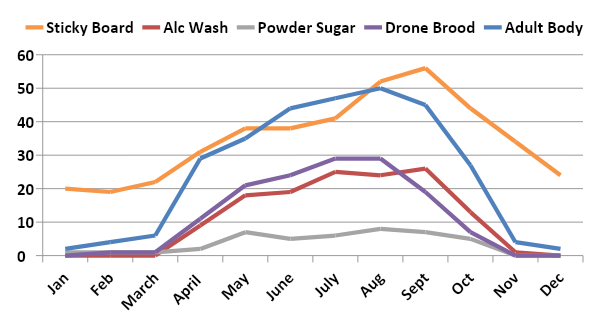
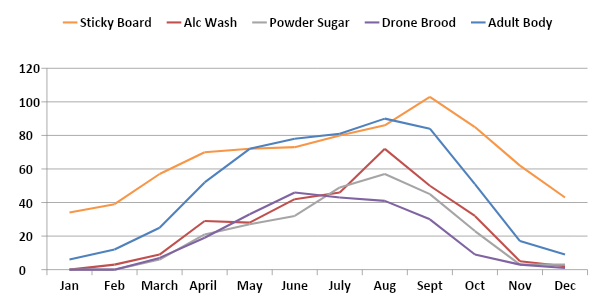
Most sampling to monitor mites was done in July – September, as might be expected since mite numbers change most quickly during these months and results of sampling can most readily be used for control decisions. See Figure 11 it illustrates by months when each of the five sampling methods were used. Figure 11
The most common sampling of respondents in 2021-22 was sampling both pre and post (41 individuals 43% of respondents); they had 34.5% loss, average for the 95 Washington beekeepers responding to this survey question. Those 29 sampling pre had a slightly better 30% loss while those 3 only sampling posts had a 57% loss. The 20 individuals who treated without sampling nor treating had 29.5% loss. The two individuals that sampled but did not treat lost all 7 of their colonies.
It is important to KNOW mite numbers. Less effective mite monitoring methods include sticky (detritus) boards below the colony (often so much detritus drops onto a sticky board that picking out the mites can be hard, especially for new beekeepers) but sticky boards used for a day can help confirm the useful of a treatment when inserted post treatment. Visual sampling is not accurate: most mites are not on the adult bees, but in the brood. Unfortunately looking for mites on drone brood is also not effective as a predictive number but can be used as an early warning that mites are present; if done, look at what percentage of drone cells had mites.
See Tools for Varroa Monitoring Guide www.honeybeehealthcoalition.org/varroa on the Honey Bee Health Coalition website for a description of and to view videos demonstrating how best to do sugar shake or alcohol wash sampling. The Tools guide also includes suggested mite level to use to base control decisions based on the adult bee sampling. A colony is holding its own against mites if the mite sample is below 2%. It is critical to not allow mite levels to exceed 2% during the fall months when bees are rearing the fat fall bees that will overwinter. It is also the most difficult time to select a control method (if one is deemed needed) as potential treatment harm may negatively impact the colony. We are seeing more colonies suddenly disappear (abscond?) during the fall, which may be related to the treatment itself.
Mite Control Treatments
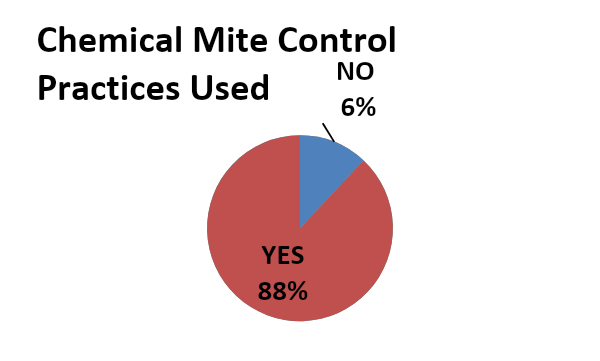
The survey asked about non-chemical mite treatments and also about use of chemicals for mite control. Seventeen individuals (14%), eight percentage points greater than last year, said they did not employ a non-chemical mite control and two individuals (1.7%), one less than last year, did not use a chemical control. Those 173 individuals who did not use a non-chemical treatment reported a 36% winter loss, while those two who did not use a chemical control lost all eight of their colonies. The individual options chosen for non-chemical and chemical control are discussed below.
Non-Chemical Mite Control: Of nine non-chemical alternatives offered on the survey (+ other category,) 220 selections were indicated 2.2/person (last year 2.1/individual). Thirty-five individuals used one method and had a 23% loss, thirty-two used two (39% loss level), eighteen used three (31% loss), fourteen used four (32.5% loss) and one used 5 (6 colonies, no loss) and one indicated six choices, losing one of seven colonies.
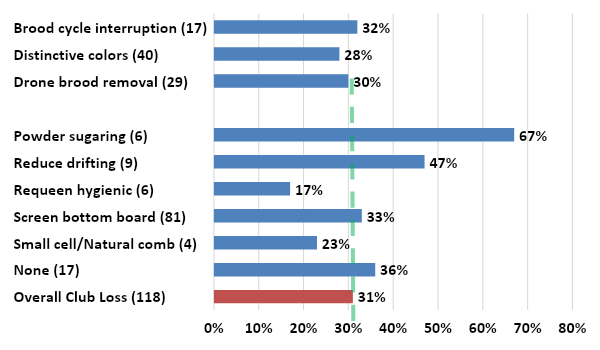
Use of screened bottom board was listed by 81 individuals (80% of individuals selecting other than none). They had a 33% loss level. The best survival choices were requeening with hygienic stock (17%) and small cell/natural comb (23% loss level, four individuals with 13 fall colonies). The use of the remaining seven selections are shown in Figure 12; number of individuals in ( ), bar length represents average loss level of those individuals using each method. Those to left of the green dashed line had better than average survival.
Two of the non-chemical alternatives – drone brood removal (29 individuals, 29.5% loss) and brood cycle interruptions (17 individuals, 32%) have also been the most useful in previous year surveys in reducing winter losses in some of past 7 years but not all. Painting hives with distinctive colors has resulted in better survival in each of the past four of the past five survey years. Small cell/natural comb had not been demonstrating better survival but did the last two years, each year by four individuals with small number of colonies (10 of 13 survived this past winter).
Figure 12
Chemical Control: For mite chemical control, two individuals (1.7% of total respondents) used NO chemical treatment; these individuals had a 100% loss level (the last three years those doing no treatments lost 100%, 61% and 67% but colony number lost (average 8) was not extensive). Those using chemicals used at rate of 2.1/individual (last year 1.9/individual). Thirty-nine individuals (46%) used one chemical and had 46% loss, 44 used two and had 30% loss, 18 used 3 (23% loss), 11 used four and had 6% loss while the two using five had an 8% loss level. Figure 13 illustrates the number of uses ( ) and bar length indicates the loss rate for those using that chemical.
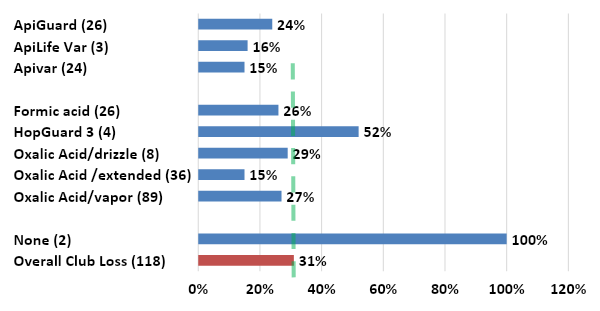
Figure 13
Within those numbers there are some other patterns. For those using one chemical, the use of OAV (oxalic vaporization) by 28 individuals had a 40% loss, those using OAV + another chemical had a 25% loss. For Apivar one-time users (17 individuals) loss rate was 14% but for the seven two-time users their loss rate was 17%. Fifteen users of Apiguard once had 19.5% loss but 11 individuals h used it twice experienced a 30% loss. Twenty single formic acid users had a 19% loss, the five who used it twice had 70% loss, yet the one individual (only two colonies) who used it three times had no loss.
Oxalic acid was used by a large number of individuals. Single OAD (drizzle) oxalic users four individuals) had 1.5% loss, those four individuals using it twice had 44% loss – overall loss was 29%. OAE (extended) users using it once had a 12.5% loss (20 individuals), the 11 using it twice had a 20% loss. Two responders said they used it three times lost 2 of 3 colonies (67%) and the three respondents using it four times (13 colonies – lost 2) had a 15% loss rate.
Individuals indicating use of OAV (vaporization of the acid) reported use once to 6+ times (6+ was the highest checkbox entry on survey). The chart shows number of times reported used, number of individuals, number of fall colony number and loss rate:
Consistently, the last seven years five different chemicals have helped beekeepers realize better survival. The essential oils Apiguard and ApiLifeVar have consistently demonstrated the lowest loss level; this year 24% and 16% loss. Over the last seven years Apiguard users had a total 32% better survival rate. Apivar, the synthetic (amitraz), has demonstrated a 34.3% total better survival over past 7 years; this year 16 percentage point better survival but last year it was nine percentage points poorer survival.
Oxalic acid vaporization over past 5 years has a 15.3% better survival (the survey did not differentiate Oxalic vaporization from drizzle prior before); this year a 4-percentage point difference. Formic acid also normally provides better survival – this year a 4-percentage point better survival.
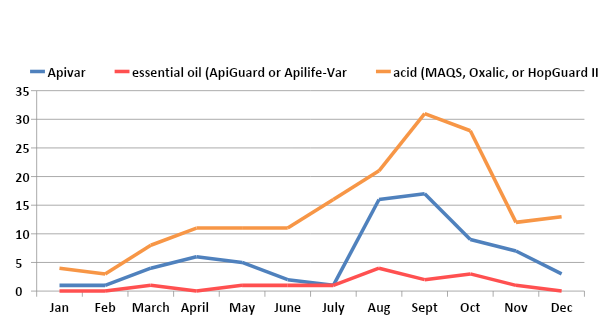
The monthly use of Apivar (blue line), essential oil (red line) or an acid (green line) is shown in Figure 16 for last year. Further review is needed to determine if the timing of treatments was more effective than at other times for the various chemicals.
Antibiotic use
One individual reported used Terramycin and all eight colonies survived. Three individuals indicated the use of Fumagillin (Fumidil-B) for Nosema control; their loss rate was 23.5%. Three Nosevet users had a 17.4 loss rate.

Queens
We hear lots of issues related to queen “problems.” Ten individuals indicated queen problems as reason for loss in earlier part of survey (Figure 6). Queen events can be a significant factor contributing to a colony not performing as expected. We asked if you had marked queens in your hives. Fifty-three individuals (45%) said yes. The related question then was ‘were your hives requeened in any form?’ to which 54% (64 individuals) said yes; equal numbers said no (23%) or ‘not that that I am aware of.’ Loss level of yes was 33%, of the nos 32% and ‘not aware of’ was 30%.
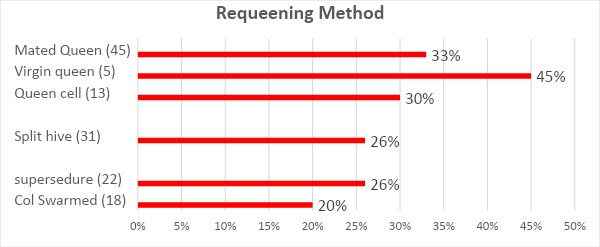
One technique to reduce mite buildup in a colony is to requeen/break the brood cycle. The question “How did bees/you requeen“ received 120 responses, 2/individual (more than one option could be checked). Thirty-three individuals indicated they requeened with a mated queen and they had a 33% loss level, five used a virgin queen (45% loss) and 13 used a queen cell (30% loss). Thirty-one said they split their hive(s) 26% loss, 18 indicated their colonies swarmed 20% loss and 22 said supersedure occurred – they had a 26% loss. Loss levels of colonies that did it themselves via supersedure and swarming (40 instances) were more favorable (23%) compared to those whose queen replacement was managed by the beekeeper via queen or queen cell (51 instances, 33% loss). Splitting colonies (31 instances) had a 26% loss rate.
Closing comments
This survey was originally designed to ‘ground truth’ the larger, national Bee Informed loss survey. The numbers while slightly different do in fact track well. Unfortunately, my commercial survey response decreased and in 2023 the national BIP survey was discontinued. See the BeeInformed website www.beeinformed.org for additional information and to examine that data base as well. The BeeInformed survey is measuring the larger scale WA beekeepers not the backyarders as loss rates are of total colony number. I have discontinued recording WA commercial/ sideliner numbers as I receive too few responses to be representative of them. Reports for individual bee groups are customized and only available from the PNW website; they are posted for previous years.
I intend to continue to refine this instrument each season and hope you will join in response next April. I have a blog on the pnwhoneybeesurvey.com and will respond to any questions or concerns you might have. Email me directly for quicker response. dmcaron@udel.edu Thank You to all who participated. If you find any of this information of value, please consider adding your voice to the survey in a subsequent season. Dewey Caron June 2024