Following the links below is the overall PNW Honey Bee Survey report for the 2015-2016 bee season compiled using all data received. Individual presentations and reports for participating Beekeeping Associations can be viewed here .
Dewey’s additional reports and significant findings in the industry;
Varroa Mite control, what worked in 2016
Current Status of Varroa Mite Control
2016 CAPA Statement on Colony Losses
Click on images below to enlarge
Winter Bee Losses of Oregon Backyard Beekeepers, 2015-2016
by Dewey M. Caron and Jenai Fitzpatrick
Overwintering losses of small scale Oregon backyarder beekeepers was elevated in 2015-2016 compared with the previous season. The reason(s) for colony losses is not always obvious as there often are several contributing factors. Herein we review and discuss the data provided by you, in an effort to weigh the loss impact factors individually. Our desired result is to educate, thereby increasing the resilience of backyard beekeeping.
This report presents the results of a 9th season of loss surveys of small-scale Oregon (hobbyist) backyard beekeepers and the 3rd season of the expanded digital version. This annual survey is conducted electronically at www.pnwhoneybeesurvey.com mid-March to first week of May and supplemented with paper surveys distributed at late-March and April at several local association meetings. In all, 271 valid surveys were returned, 210 from Oregon and 52 from Washington beekeepers.
Section 1: Characterization of survey respondents
Surveys were received from members of 14 local Oregon (OR) associations and several Washington associations. The majority of the OR respondents (79%) kept bees in the Willamette Valley of Oregon. Additional surveys were received from Coastal beekeepers, Hood River, Klamath Basin and Southern Oregon beekeepers. The majority (72%) of Washington responses were from beekeepers in the I-5 corridor Vancouver to Tacoma area, most (48%) from Lewis County.
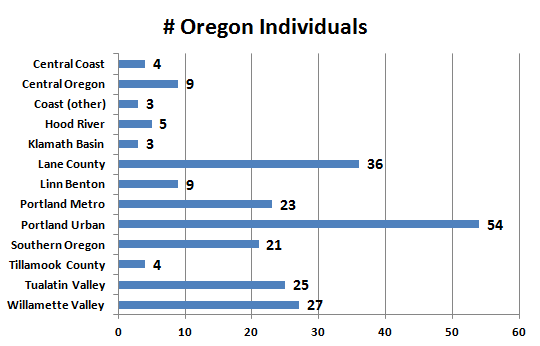
Figure 1 – Membership affiliation does not mean all respondents were dues paying member of a local association. Some respondents, not indicating a local association, were placed into a group based on geographic location of primary apiary. Some respondents belong to more than one group which are not included here.
Portland Urban (PUB) with 54 Individuals and Lane Co (Eugene) with 36 individuals were the most numerally represented of the Valley groups as in the previous season. Associations with 20+ survey returns were PUB, TVBA and PM in the Portland area, and WVBA in Salem, LCBA in Eugene, Southern Oregon and Lewis Co in Washington. Only Klamath Basin had a significant decrease in returns this season compared to last season.
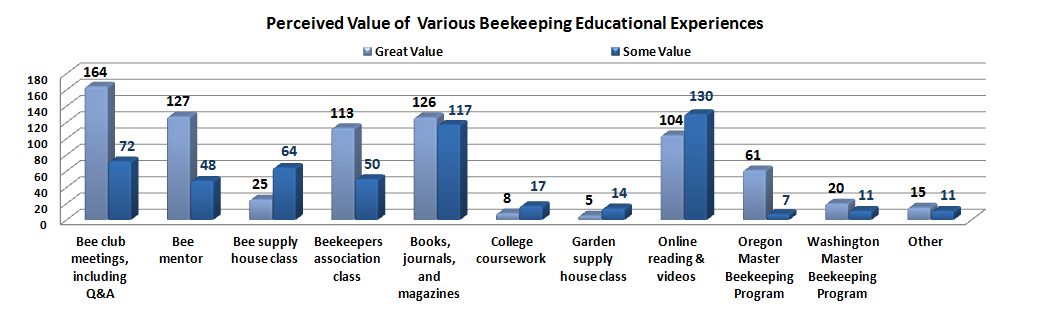
Figure 2
In this snapshot of our industry, we asked individuals to identify the major source of their beekeeping education. Bee club meetings, including Q & A, were chosen as the selection of greatest value. Bee Mentors and Books/journals and magazines were similar followed by Beekeeper association classes and Online reading and videos. Online readings and video and Books/Journals and magazines were the highest response listed to be of some value. Figure 2 below shows PNW (both OR & WA) responses. The survey response this year was similar to last year.
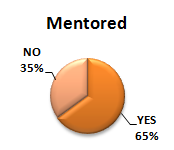
Figure 3
We asked if there was a mentor available for the first years of beekeeping. 65% of PNW beekeepers indicated YES. This is encouraging as the learning curve is a steep one for new beekeepers and mentors can significantly help new individuals. Both Oregon and Washington Master Beekeeper programs help identify mentors for new beekeepers.
To better characterize the respondent population, we asked how many colonies and how many years of beekeeping experience survey respondents had. The majority of individuals (77%) completing a survey had 1, 2 or 3 colonies, with a range of 0 to 43 colonies (Medium =3, average = 3.9 colonies per individual); 22 individuals (8%) had 10 or more colonies. The medium years of experience was 3 years with 52% of respondents having 1, 2 or 3 years of experience; 33 individuals (12%) had ten years or more of experience with 5 individuals listing 40 or more years experience. The majority of surveys are being returned by new beekeepers, the same individuals that constitute the majority of active club attendees.

Figure 4
We express the measure of experience of beekeeping in Hive Years. This number is obtained by multiplying the number of hives by number of years of experience. Together the two speak to greater involvement in bees. The hive years distribution is shown in Figure 4. As evident, 78% of our PNW respondent population had 25 or fewer Hive Years.
Section 2: 2015-2016 Overwinter losses (based on hive type)
The loss statistic was developed by our asking number of fall colonies and number in the spring by hive type. Results are shown in bar graph of Figure 5 along with number of fall and spring hives and number of individuals. Forty nine individuals (18%) maintained more than one hive type. Total PNW (OR and WA) backyard beekeeper overwinter loss = 43.8% loss.
The 35% winter losses of PNW 8-frame Langstroth hives, was 10 percentage points lower than the 45% loss rate of 10-frame Langstroth hives. Last year, both 8 and 10-frame Langstroth hives had a 27% loss rate. Nuc (5-frame) hive loss and top bar hive losses both exceeded 50%, as they did last year. Warré hive loss was similar to Langstroth hive loss and only 3 percentage points different from last year. Of the 9 “other” hive types, 4 were long hives, 3 feral and 2 mini-hives.
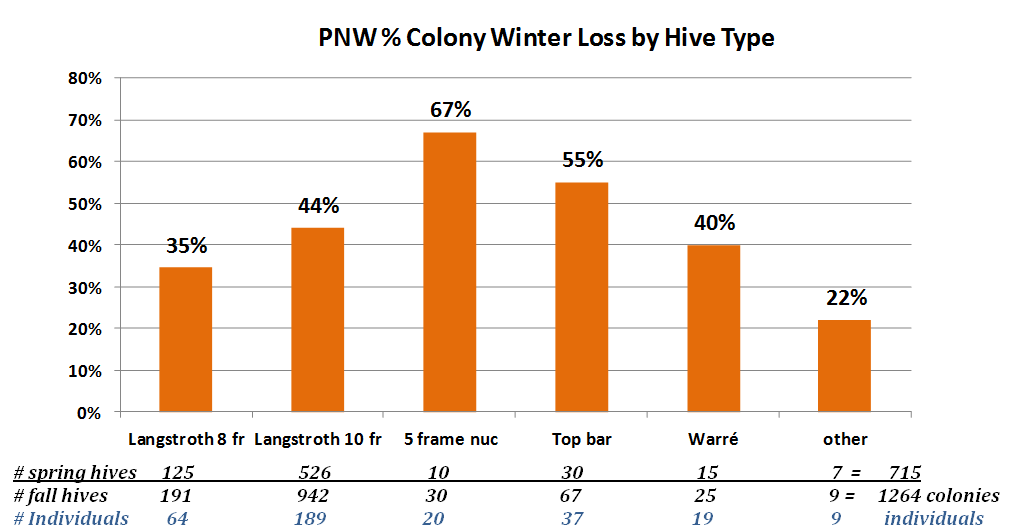
Figure 5
The 219 Oregon beekeepers with 1,009 fall colonies suffered a 40% winter colony loss while the 52 Washington beekeepers, entering the fall with 261 colonies had a higher loss rate of 60%. Bar graphs compare the two states below. The reason(s) for higher losses in Washington is unknown but the lower number of respondents in Washington compared to Oregon could be partly responsible. Small numbers, such as with individual clubs, are more difficult to interpret and are not as reliable since one or two returns can considerably skew results.
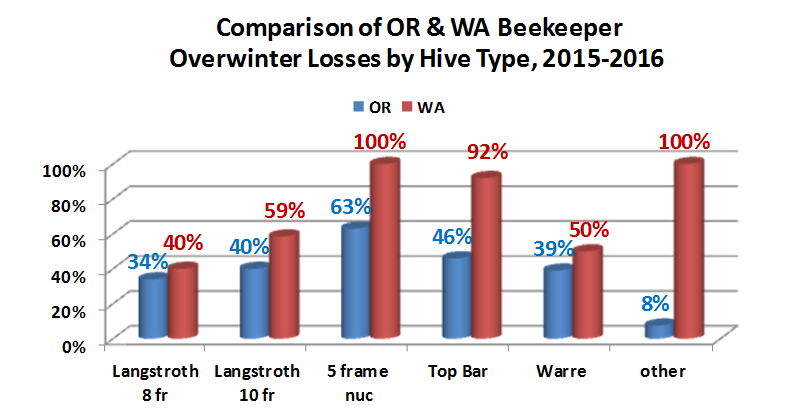
Figure 5a
Thirty-one percent of PNW respondents had NO LOSS overwinter, whereas 24% lost 100% of fall colonies. 36% of Oregon-only respondents had NO LOSS whereas 21% had TOTAL LOSS. Fifty-one percent of respondents (both PNW and OR) lost 1, 2 or 3 colonies. The greatest numerical loss was one colony. Highest loss of Washington respondents was 10 and for Oregon beekeepers 16 colonies. Three percent lost 10 or more colonies. Figure 6 shows this data (first column Blue/Orange=PNW, 2nd column Red=Oregon). Numbers are reflective of the fact that backyarders keep on average 3 colonies, although some have more colonies.
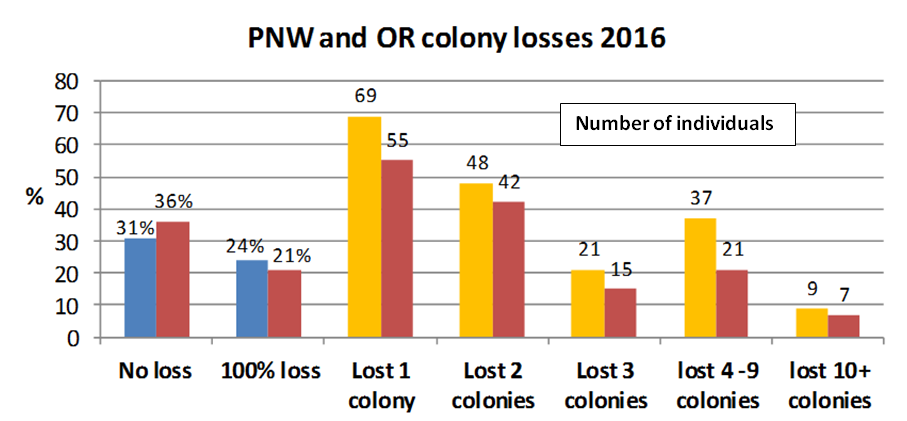
Figure 6
Section 3: Loss rates at different locations
We asked loss related to location of the hive. Eighty percent of respondents kept bees at a single location. Of those with multiple locations, an additional 7.5% had two apiaries; up to 5 apiary locations were reported for one individual. Loss numbers were highest for the 1st apiary site (46%); lower losses of 34, 39 and 33% respectively were reported for 2nd, 3rd and 4th apiary site. Information supplied on location will be used to develop location maps similar to maps prepared by Jenai in 2014.
Overwinter losses of members of different organizations are shown in Figure 7. The loss rates varied from a low of 20% for the 14 members of Linn Benton Association to a high of 80% for the 3 respondents from Klamath Basin. PUB had the highest number of respondents and had the 2nd highest loss level of Oregon Associations. In Washington, Lewis County had the highest respondent number (25) and, along with 5 Clark County beekeepers, the lowest loss rate (47%); Pierce County had the highest loss rate (75%) among WA associations. Numbers to right are the loss rate and numbers following association group name indicate number of 2015-2016 respondents. Last year Klamath Basin had the lowest loss 10% and Central OR had the highest 60%. Of the 5 clubs with more than 20 respondents, PUB for the third consecutive year had the highest loss level (45%). Website and individual club reports discuss seasonal fluctuations.
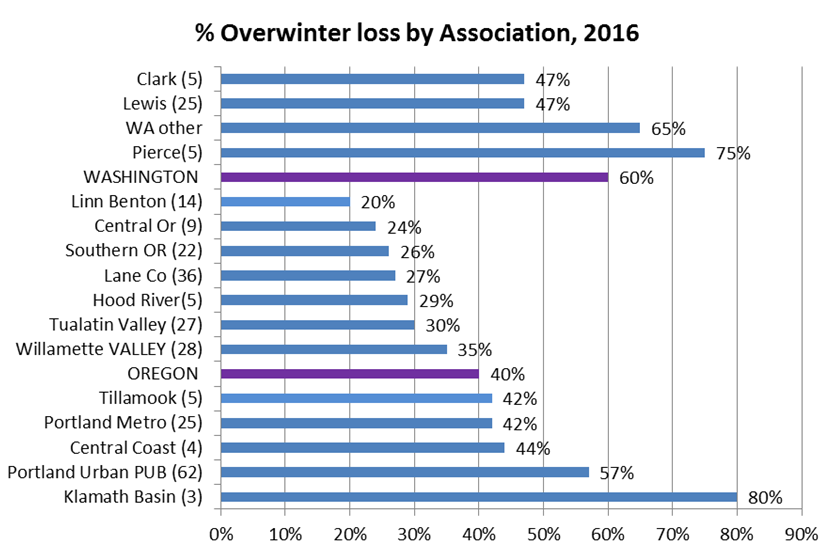
Figure 7
Comparison to larger-scale beekeeper losses.
A different (paper) survey instrument was mailed to Pacific Northwest (PNW) semi-commercial (50-500 colonies) and commercial beekeepers (500+) asking about their overwintering losses. Nineteen Oregon commercial and semi-commercial beekeepers (36,649 colonies, approximately 50% of the estimated total number of colonies in the state) overwinter losses were 16.1%. For the 3-state region, 45 PNW commercial and semi-commercial beekeepers (representing approximately 53% of the colonies of the 3 states) had a loss rate of 16.7%. The 2016 Bee Informed national survey (5,700+ respondents, 95% backyarders) estimated national overwinter losses at 28%. Comparisons are shown in Figure 8. Backyard losses, over double the losses of larger-scale beekeepers, have consistently been higher over 7 years of survey responses. Commercial and semi-commercial beekeepers take losses in the fall and are more pro-active in varroa mite control management.
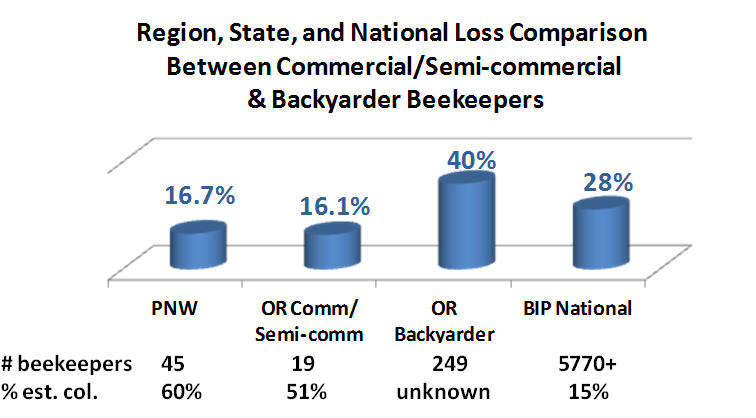
Figure 8
Last season, for comparison, 41 PNW commercial and semi-commercial beekeepers (representing approximately 60% of the colonies of the 3 states) had a loss rate of 15.7% and OR backyarders (250 total) had a 29% colony loss rate. The 2015 Bee Informed national survey, (23% loss rate nationally) estimated total Oregon beekeeper losses at 25.2% and 39.3% for Washington beekeepers. Our purpose to “ground truth” the National survey seems to be valid as our PNW and Oregon numbers are in general agreement.
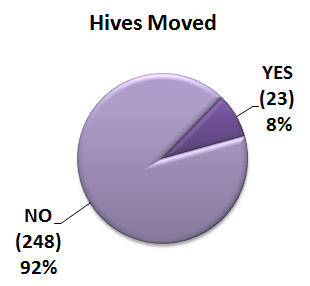
Figure 9
A few individuals moved one or more of their colonies this past season. They listed many reasons for doing so. Seven moved for a better location, five to pollinate, 4 needed to move due to neighbor “issues”, and four moved splits/swarms away. A couple moved their apiary when they moved, or to move away from bears, to supply a friend with a colony or to reduce number at the primary apiary site.
Section 4: Survival based on hive origination
We also asked survey respondents to characterize their loss by hive origination. The result is graphically presented below in Figure 9 for both PNW and Oregon beekeepers. Packages, split/divides and feral hive transfers were less than 50% successful. Swarms exhibited higher losses than nucs. Overwintered colonies, as expected, consistently have the best survival rate. Figure 10 shows PNW and Oregon loss rates by hive origination and PNW loss levels for the previous season. It is evident that rates for both are relatively the same both seasons.
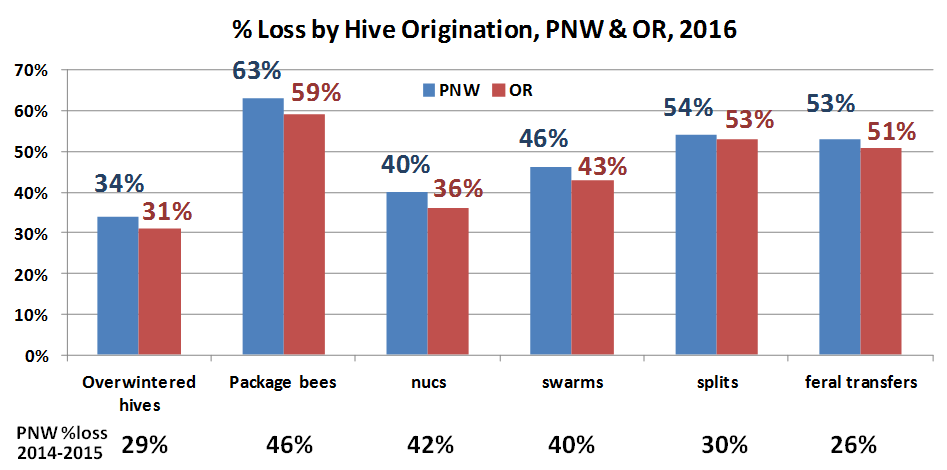
Figure 10
Section 9: Colony Death perceived reason and acceptable level.
We asked PNW individuals that had colony loss (recall 31% had NO LOSS) to estimate what the reason for their loss might have been. Most common responses were Weak in the fall and Varroa mites, followed closely by Queen failure. Starvation, poor wintering conditions and I don’t know were all indicated by 11%. Yellow jackets, CCD (Colony Collapse Disorder, a general loss symptom whereby the adults die away from their hive), Pesticides and Nosema followed in that order. Under “other”clumsiness and EFB were listed.
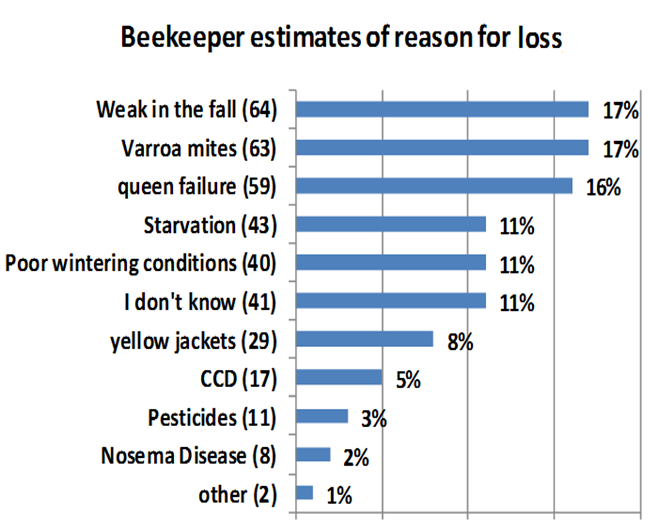
Figure 11
There is no easy way to verify reason(s) for colony loss. Colonies in the same apiary may die for different reasons. Doing the forensics is the first step in seeking to solve the heavy loss problem. More attention to colony strength and possibility of winter starvation will help reduce some of the losses. Control of varroa mites will also help toward loss reduction. Our survey, asked about managements, mite controls and queens as can be read in following sections 5-9.
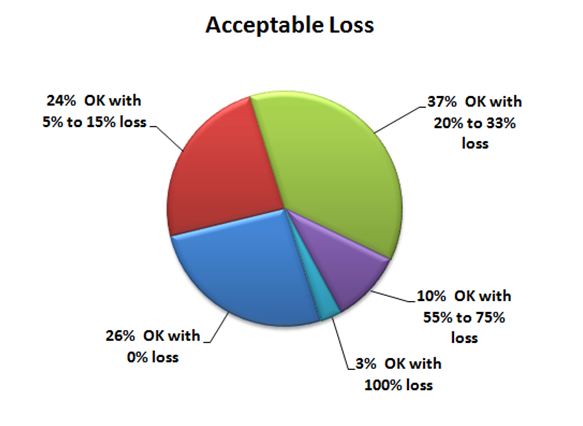
Figure 12
Respondents were asked to select an acceptable loss level, being offered several categories to check. Twenty six percent (26%) said zero, 24% said 5-15% and 37% checked 20-33%. Eight individuals (3%) said 100% was acceptable.
Why do colonies die?
There clearly appears to be no single reason for loss and a good deal of variance in opinion as to what might be an acceptable loss level. There is nobody to come check why a dead colony died. Close examination may eliminate some possible factors but we are still often left with more than one “likely” cause of death.
We are dealing with living animals which are constantly exposed to many different challenges, both in the natural environment and the beekeeper’s apiary. The four major factors in colony loss are thought to be mites, pesticides, declining nutrition adequacy of the environment and diseases, especially viruses and Nosema. Management, failure to do something or doing things incorrectly, remains a factor in our losses as does alteration to the bee’s natural environment.
Langstroth wrote about the importance of taking losses in fall management saying if the beekeeper neglects such attention to his/her colonies, 45% loss levels may occur, depending upon variable environmental conditions. It can be argued that losses of 30, 40, 50% or more might be “normal.” Older, more experienced beekeepers recall when loss levels were 15% or less. Honey production fluctuates each year but, once again, seems to be declining on average. Numbers of U.S. bee colonies have declined steadily since the 1940s, returning to numbers for 100 years ago,but worldwide numbers of bee colonies are steadily increasing.
So there is no simple answer to explain the levels of current losses nor is it possible to demonstrate that they are excessive for all the issues facing honey bees in the current environment.
Section 5: General hive practices
We asked in the survey for information about some managements practiced by respondents. Multiple responses were encouraged.
FEEDINGS: The numbers of PNW beekeeper feeding responses (548 total) are shown in bar graph Figure 13. Number following practice is number of those individuals who indicated each item and percent to right the rate of use. Twenty eight individuals (10%) did not do any of the options offered; they had a 58% loss of colonies, compared to 43.7% overall losses. This is up from 7% the previous survey year. Of those who indicated doing feeding, feeding sugar syrup (169 individuals, 31%) and feeding pollen patties (106 individuals, 19%) were the most common feeding managements followed by feeding frames of honey. Next most common were feeding hard sugar candy and dry sugar or drivert. Frames of pollen, liquid honey and dry pollen were less commonly fed. One individual fed corn syrup. Under “other,” feeding vitamins and electrolytes, honey-B-healthy (2 individuals) and feeding essential oils were listed.
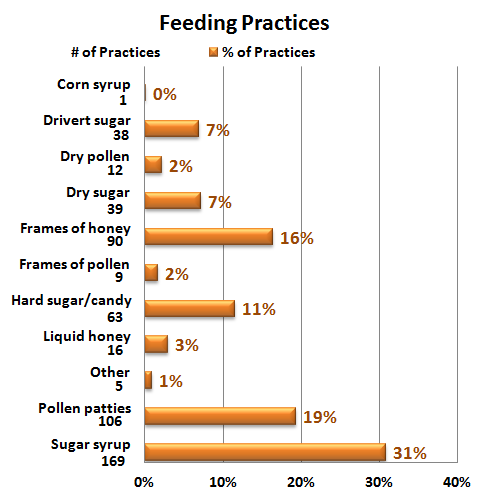
Figure 13
Last year, the three highest selections were the same as this year; feeding dry sugar was 4th most frequently selected compared with the hard sugar/candy this year. Results indicate a high level of feeding management of both sugars and supplemental protein. Sixty one percent of individuals did more than one thing, 28% checked two items and 34% did 3 or more including one individual who selected 7 different choices. Except for Screen bottom board, no one choice offered a survivorship advantage; feeding hard candy, dry sugar or fondant is preferred during the rainy months so as not to add additional moisture stress to PNW colonies.
WINTERING PRACTICES: We received 498 responses about PNW beekeeper wintering management practices (more than one option could be chosen). Fifty five individuals (20%) percent of the respondents indicated none of the several listed wintering practices was done; it was 15% last year. The most common wintering management selected (121 individuals) was ventilation/use of a quilt box/insulating board at colony top. Use of a rain shelter was next most common, then upper entrance followed closely by wind/weather protection. Figure 14 shows number of individual choices and percent of each selection.
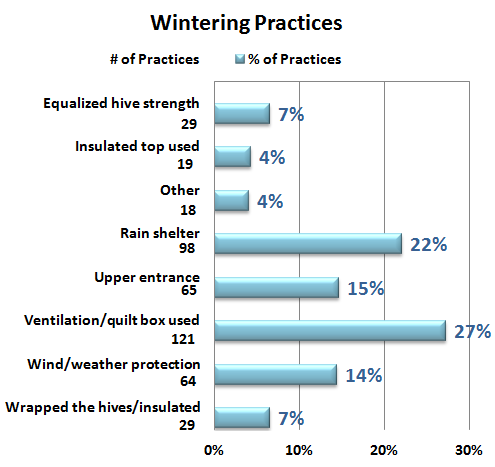
Figure 14
Among the 18 “other” responses were use of screen bottom board or slatted rack, entrance reduction, tipping hives forward, removal of extra boxes/equipment, clustering hives together for warmth or moving them inside a shed. The wintering selections and all of these “other” managements demonstrate that backyard beekeepers are taking extra measures to help colonies survive winter conditions. Thirty six individuals did one of these wintering practices while 63% did 2 to as many as 7 of them in case of one individual. The individuals who used the ventilating quilt on top of the colony (29 individuals did ONLY this wintering practice) had a 39% loss, compared to 43.7 overall, indicating such a device might offer a small survival advantage.
SANITATION PRACTICES: It is critical that we practice some basic sanitation (some prefer use of term bee biosecurity) in our bee care. We can do more basic sanitary practices to help insure healthy bees. We received 396 responses for this survey question. NOTE: Some of the choices are not sanitation but rather mite control options and will be modified next season. Twenty-four percent (65 individuals) said they did not practice any of the 8 offered alternatives; they had a loss rate of 54% compared to overall rate of 43.7%. Minimal hive intervention (59%) was the most common option selected. It could be argued that less intervention might mean reduced opportunity to compromise bee sanitation efforts of the bees themselves. Needless, excessive inspections/manipulations can potentially interfere with what the bees are doing to stay healthy. This option however did not improve winter survival as the 159 individuals doing this had a slightly higher loss rate, 44.6% compared to 43.7% overall.
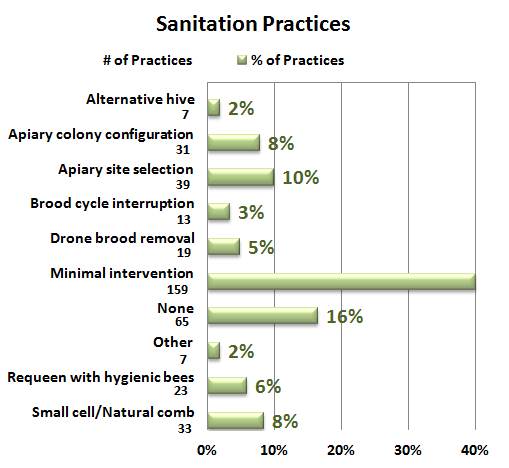
Figure 15
Following minimal hive intervention, the remaining selections were all 10% or less in frequency of selection as shown in Figure 15. Apiary site selection and colony configuration within the apiary, although not commonly utilized by PNW beekeepers, are important sanitation choices because giving colonies a distinctive “addresses” has been shown to reduce drifting of adult bees and help to reduce incidence of disease and mites. The 70 individuals that checked these two choices (10 checked both) had a 36% loss, slightly better than the overall rate of 43.7%. Small cell/natural brood comb, along with the options of requeening with hygienic bees, drone brood removal and brood cycle interruption are all active management options designed to help reduce mite levels, and while important, might not necessarily be considered sanitation. Refer to section 7 for responses to question on non-chemical control mite control for a better representation of use of these management techniques. Among “other” sanitation methods indicated by respondents were increase in sun exposure (by cutting trees), bolstering the colony with transfer of young brood and cleaning of the bottom screen slide.
SCREEN BOTTOM BOARDS: In our national BeeInformed (BIP) surveys, fully 95% of respondents indicate they have modified colony bottom boards as a screen bottom. In contrast, 17% of PNW beekeepers said they did not use screened bottoms; 66% used them on all their hives. As shown, over 50% leave the boards open over the winter period (never response). A little over a quarter blocked them. Of the individuals not using the SBB, their loss rate was 49% of those using them on 100% of their colonies reported a loss rate of 41.9%.
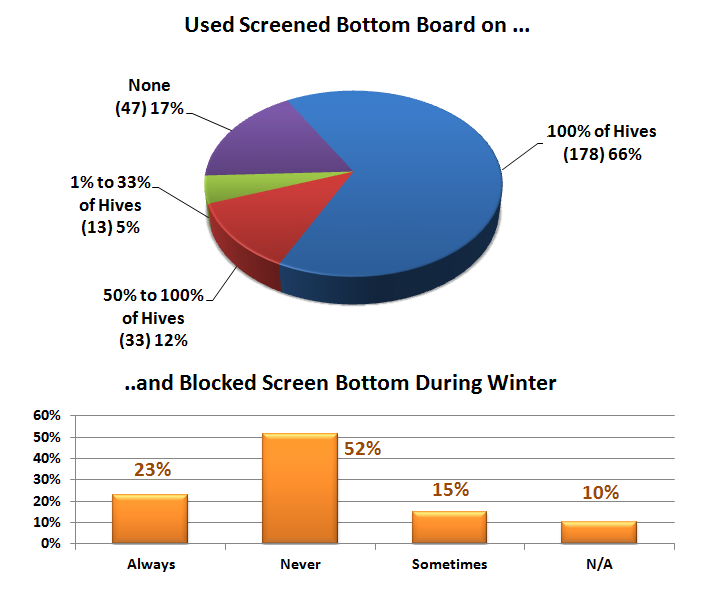
Figure 16
There is no good science on whether open or closed bottoms make a difference in overwinter but some beekeepers “feel” bees do better with it closed overwinter. An open bottom, at least part of the year, can assist the bees in keeping their hive cleaner.
Section 6: Mite monitoring/sampling and control management
We asked percentage of PNW hives monitored for mites during the 2015 year and/or overwinter, whether sampling was pre- or post-treatment or both and, of the 5 possible mite sampling methods, what method was used and when it was employed. In order of popularity of use, Sticky boards were used by 33%, down slightly from the previous year.
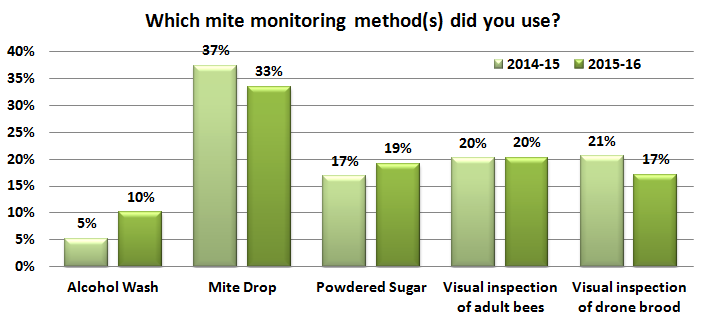
Figure 17
Use of visual inspect of adults, powdered sugar shake and visual inspection of drones were all used about the same amount, around 20%. Alcohol wash was utilized 10% of the time. Preferred monitoring methods are sugar shake or alcohol wash; sticky boards can help indicate a potential problem but are not sensitive enough to help with control decisions. Visual inspections of adults or drone brood are NOT particularly effective methods.
Most sampling to monitor mites was done in July – October as might be expected when the mite numbers change most quickly and sampling can most readily be used for control decisions.
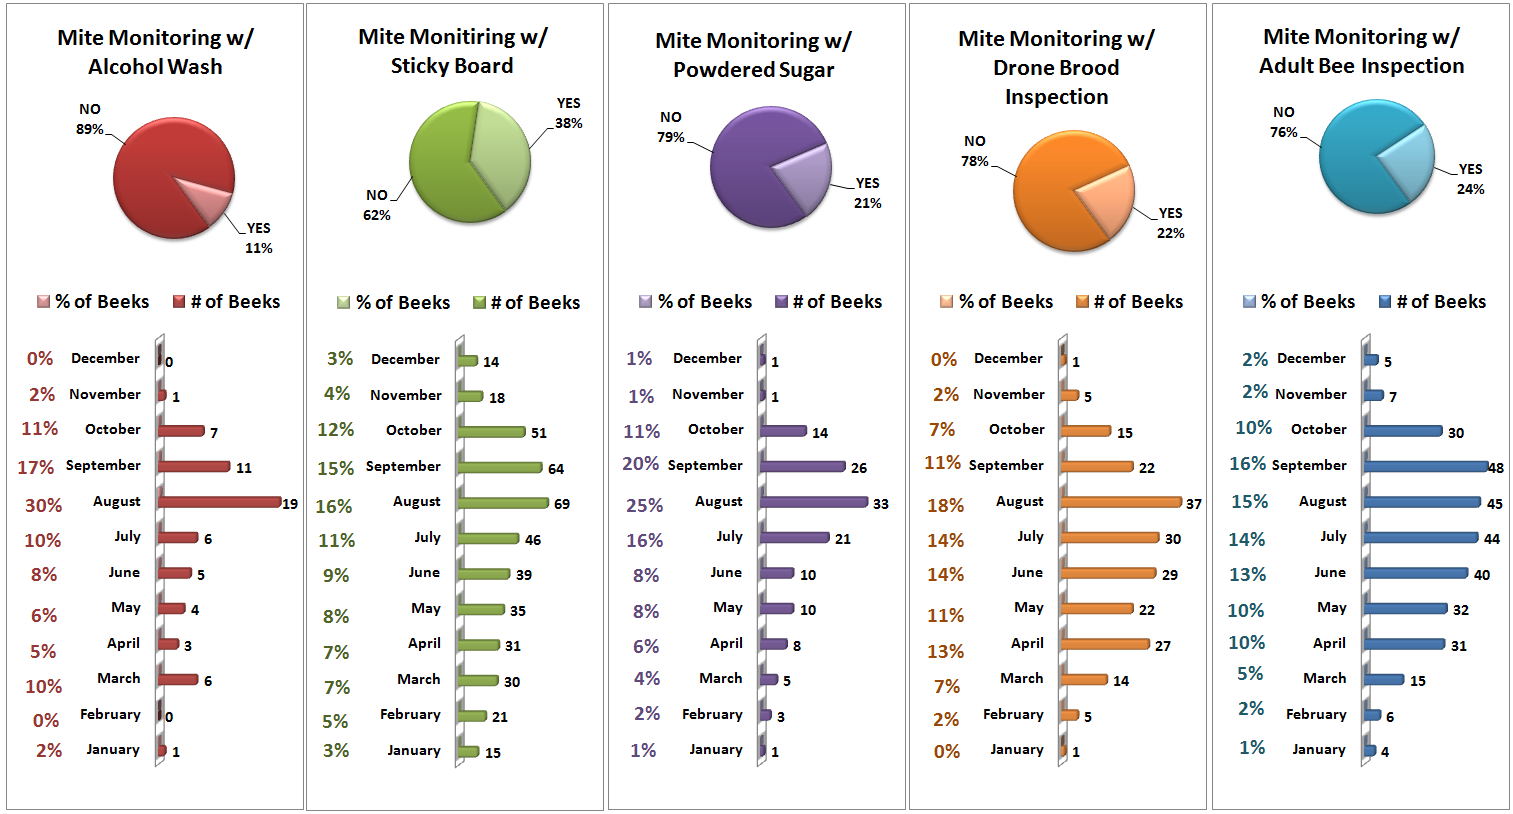
Figure 18
Nearly 2 of every 5 apiaries were not monitored for mites while half were monitored 100%. Pre-treatment monitoring (26%) and both pre- and
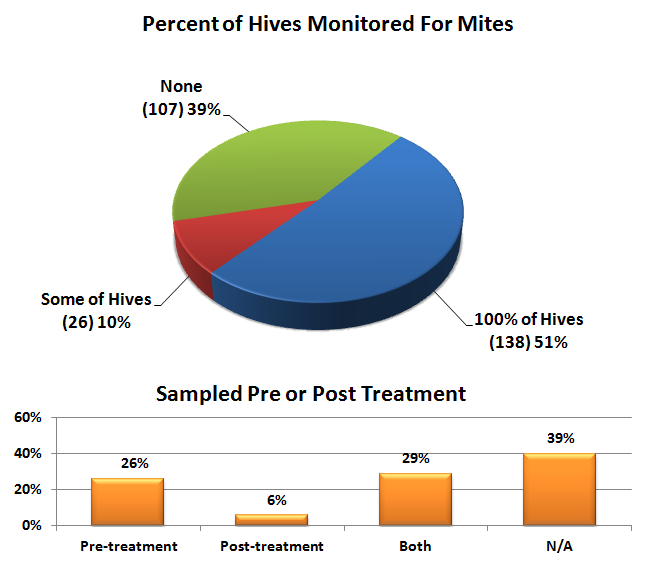
Figure 19
post-treatment monitoring was done by 29% of respondents. Pre-treatment can help with control decisions. It is also important to check for control effectiveness, once completed, by post-treatment monitoring.
Section 7: Use of medications and control treatments
We asked about general non-chemical mite treatments and also about use of chemicals for mite control. Fifty seven percent (156 individuals) said they did employ a mite control (alternative or chemical). Non-treatment may be by default, a decision based on sampling results or beekeeper philosophy.
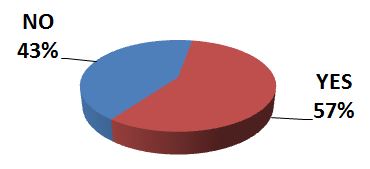
Figure 20
Not all colonies need be treated as mite numbers can vary by location and year. Those who did use a treatment reported a 32.7% winter loss while those who did NOT had double that number, a 67.4% loss rate.
Non-Chemical Mite Control: Of nine non-chemical alternatives offered on the survey, 81 PNW respondents (30%) indicated they did not use any of the choices; last year it was 12%: loss rate was 56% for those not using any of the treatments. For the respondents who checked at least one choice other than none (more than one selection was permitted), use of screened bottom board was listed by 147 individuals. The next most common selection was minimal hive inspection.
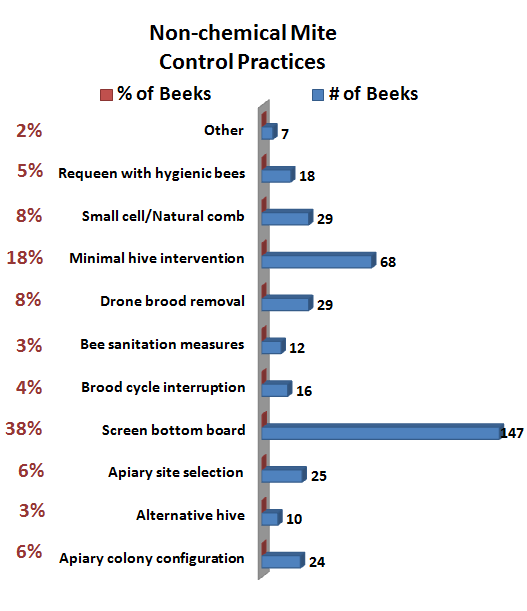
Figure 21
The remaining 7 selections were indicated by 8% or fewer respondents; drone brood removal and small cell/natural comb was the most popular choices. Under other, 2 individuals listed grease patties (a tracheal mite control) and an equal number listed powdered sugar (an ineffective varroa control method) and one said natural swarming. See Figure 21. Although doing something resulted in higher survivorship, none of the alternatives was, by itself, especially helpful.
The frequencies of mite controls utilized by the respondents to this survey were very similar to the selections chosen last year. Figure 22. The manipulations that show the best winter survival rate; drone brood removal, use of brood interruption and introduction of a hygienic queen are all labor intensive and require some experience to complete. They work well only under limited circumstances.
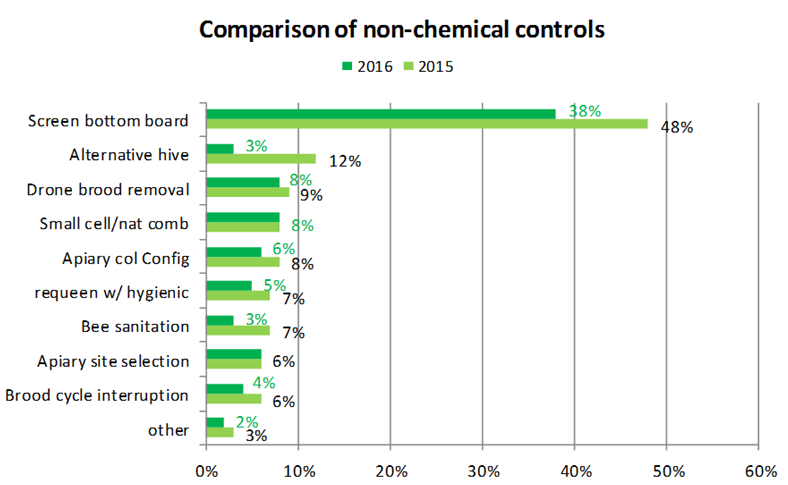
Figure 22
NOTE: that under sanitation management (Figure 15) these sometimes difficult management activities were also response options. Timing of use is critical to successful completion in time for the bees to winter.
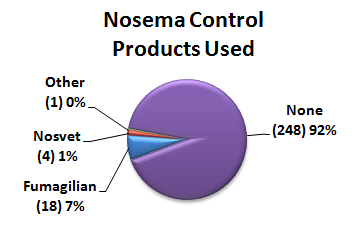
Figure 23
Three individuals of 23 that responded indicated they fed Terramycin for foul-brood disease, Figure 23. Eighteen individuals (7%) indicated use of Fumigillan for Nosema disease control. Four used Nosvet and one Honey Bee Healthy as seen in Figure 23. Use of these antibiotics may be helpful but they are not recommended as a general prophylactic.
Chemical Control: For mite chemical control, 23% PNW Beekeepers indicated they most commonly utilized Apiguard (essential oil thymol), followed by Formic acid (21%) MAQS. Apivar (amitraz) was the third most common, used by 15% of individuals followed by powdered sugar (13%).
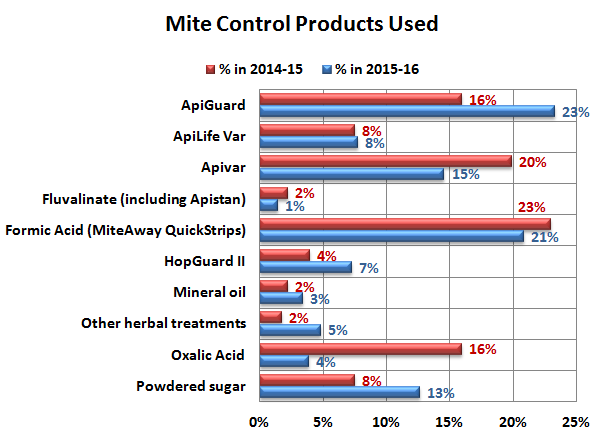
Figure 24
Comparisons to responses last year are included in Figure 24; Powdered sugar use, a technique that is not very effective, was nearly double last year while. Apivar, the synthetic miticide that is the most effective treatment, was used by a quarter fewer this past year and Oxalic acid, the newest control and effective when used correctly, was used by only 4% of individuals, a decrease by 3/4ths from the previous year. The significance of such wide changes this year is unknown.
Use of a chemical control was most significant in improving winter survivorship. Apivar, the synthetic amitraz chemical, was used by 43 individuals and they had a much better survival rate with only a 23% loss rate. Twenty one individuals used ONLY Apivar, 15 used 2 chemical materials, 5 used 3 chemicals and 1 each used 4 & 5 chemicals. MAQS (Formic acid) was also very helpful for improving survivorship. MAQS was used by 42 individuals and they too had only a 23% loss rate. Among the 42 individuals, 17 used ONLY MAQS, 16 used 2 chemicals, 9 individuals used 3 and 1 each used 4 & 5 chemicals.
The essential oil Apiguard was used by 32 individuals and they had a 26% loss; 14 individuals used ONLY Apiguard, 10 used 2 chemicals, 7 used 3 and 1 used 5 chemicals. Oxalic acid was used by 30 individuals; they had a loss rate of 35%; 7 of these individuals used ONLY Oxalic acid, 15 used 2 chemicals, 7 used 3 and 1 used 4. Even use of Powdered sugar decreased loss. Powdered sugar was the chemical choice of 16 individuals; the loss rate was 29% of the 16 individuals, 7 used ONLY PS, 2 chemicals were used by 3 individuals and 4 used 5 chemicals.
For more details on the treatments for varroa see previous reports Varroa Mite Control what worked in 2016 & Current Status of Varroa Mite Control.
Section 8: Queens
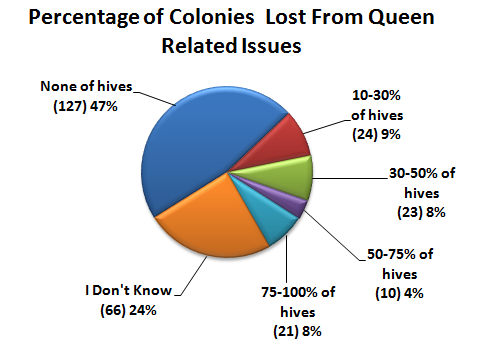
Figure25
We hear lots of issues related to queen “problems”. On the survey we asked what percentage of loss could be attributed to queen problems. Over 70% said none or I don’t know (24%). Number of individuals, in ( ), and percentage of estimate of loss rate is shown in Figure 25.
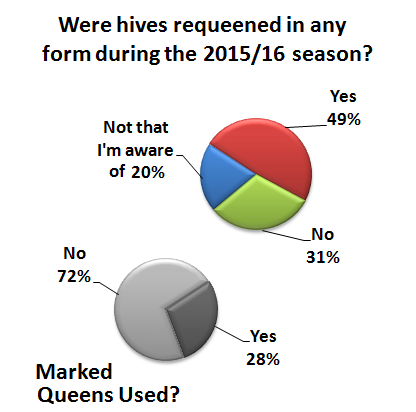
Figure26
Queen events can be a significant factor contributing to a colony not performing as expected. We asked “Did you or did your hive requeen, in any form during the year”. Thirty one percent said no, 49% said yes while the remainder saying “Not that they were aware of.” See Figure 26. Responses were very similar to previous year with 5 percent more saying no and 4% fewer saying yes.
We asked if queens were marked. Only 28% said yes. Outside of the beekeeper requeening a colony it would be difficult to say yes or no to question about colony requeening in the absence of queen marking.
The question “How did bees/you requeen“ received 132 responses as illustrated in Figure 27. Nearly half of respondents indicated their bees requeened via swarming and supersedure. It can be useful as the brood break will reduce mite population buildup. Mated queen introduction was indicated 29% of the time and splitting hives 16%. Other responses are shown in Figure 27.
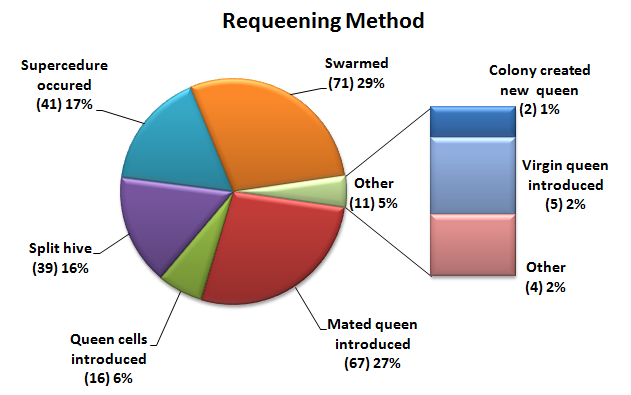
Figure27
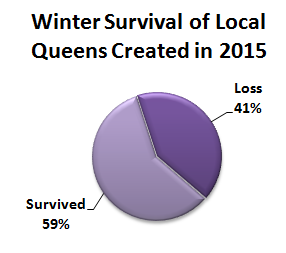
Figure28
Fifty one individuals indicated they reared 150 local queens via splitting, grafting or other method. Three-fifths survived winter. Local survivor stock may have some value in reducing mite populations.
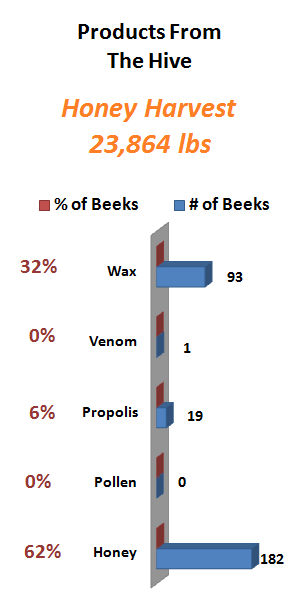
Figure 29
A new question this year was products harvested. The responses are shown in Figure 29. Honey harvest reported represents 159 pounds per individual.
Closing comments
This survey is designed to ‘ground truth’ the larger, national Bee Informed loss survey. Some similar information is additionally available on the BeeInformed website and individuals are encouraged to examine that data base as well. Reports for individual bee groups are customized. They are posted by the name of the group.
We intend to continue to refine this instrument each season and hope you will join in response next April. If you would like a reminder when survey is open please email us with “REMINDER” in the subject line. There is also a blog and will respond to any questions or concerns you might have.
Thank You to all who participated. If you find any of this information of value please consider adding your voice to the survey in a subsequent season. Dewey Caron and Jenai Fitzpatrick, June 2016